Hertz 2007 Annual Report Download - page 99
Download and view the complete annual report
Please find page 99 of the 2007 Hertz annual report below. You can navigate through the pages in the report by either clicking on the pages listed below, or by using the keyword search tool below to find specific information within the annual report.-
 1
1 -
2
-
3
-
4
-
5
-
6
-
7
-
8
-
9
-
10
-
11
-
12
-
13
-
14
-
15
-
16
-
17
-
18
-
19
-
20
-
21
-
22
-
23
-
24
-
25
-
26
-
27
-
28
-
29
-
30
-
31
-
32
-
33
-
34
-
35
-
36
-
37
-
38
-
39
-
40
-
41
-
42
-
43
-
44
-
45
-
46
-
47
-
48
-
49
-
50
-
51
-
52
-
53
-
54
-
55
-
56
-
57
-
58
-
59
-
60
-
61
-
62
-
63
-
64
-
65
-
66
-
67
-
68
-
69
-
70
-
71
-
72
-
73
-
74
-
75
-
76
-
77
-
78
-
79
-
80
-
81
-
82
-
83
-
84
-
85
-
86
-
87
-
88
-
 89
89 -
 90
90 -
 91
91 -
 92
92 -
 93
93 -
 94
94 -
 95
95 -
 96
96 -
 97
97 -
 98
98 -
 99
99 -
 100
100 -
 101
101 -
 102
102 -
 103
103 -
 104
104 -
 105
105 -
 106
106 -
 107
107 -
 108
108 -
 109
109 -
110
-
111
-
112
-
113
-
114
-
115
-
116
-
117
-
118
-
119
-
120
-
121
-
122
-
123
-
124
-
125
-
126
-
127
-
128
-
129
-
130
-
131
-
132
-
133
-
134
-
135
-
136
-
137
-
138
-
139
-
140
-
141
-
142
-
143
-
144
-
145
-
146
-
147
-
148
-
149
-
150
-
151
-
152
-
153
-
154
-
155
-
156
-
157
-
158
-
159
-
160
-
161
-
162
-
163
-
164
-
165
-
166
-
167
-
168
-
169
-
170
-
171
-
172
-
173
-
174
-
175
-
176
-
177
-
178
-
179
-
180
-
181
-
182
-
183
-
184
-
185
-
186
-
187
-
188
-
189
-
190
-
191
-
192
-
193
-
194
-
195
-
196
-
197
-
198
-
199
-
200
-
201
-
202
-
203
-
204
-
205
-
206
-
207
-
208
-
209
-
210
-
211
-
212
-
213
-
214
-
215
-
216
-
217
-
218
-
219
-
220
-
221
-
222
-
223
-
224
-
225
-
226
-
227
-
228
-
229
-
230
-
231
-
232
-
233
-
234
 |
 |

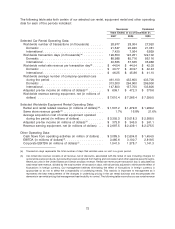
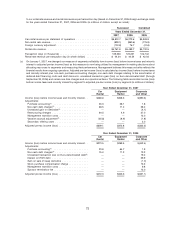
The following table reconciles historical net cash provided by (used in) operating activities to EBITDA for the years
ended December 31, 2007 and 2006, the combined year ended December 31, 2005, the Successor period ended
December 31, 2005 and the Predecessor period ended December 20, 2005, respectively (in millions of dollars):
Successor Combined Successor Predecessor
For the Periods From
December 21, January 1,
2005 to 2005 to
Years ended December 31, December 31, December 20,
2007 2006 2005 2005 2005
Net cash provided by (used in)
operating activities .......... $3,089.5 $2,604.8 $1,454.5 $(277.8) $1,732.3
Stock-based employee
compensation ............. (32.9) (27.2) (10.5) — (10.5)
Amortization of debt and debt
modification costs .......... (85.3) (105.0) (9.1) (1.8) (7.3)
Unrealized gain (loss) on derivatives 3.9 (2.5) 2.7 2.7 —
Unrealized transaction (loss) gain on
Euro-denominated debt ....... — (19.2) 2.8 2.8 —
Gain on sale of property and
equipment ............... 24.8 9.7 4.1 0.3 3.8
(Loss) gain on ineffectiveness of
interest rate swaps .......... (20.4) 1.0 (1.0) (1.0) —
Minority interest ............. (19.7) (16.7) (12.6) (0.3) (12.3)
Deferred taxes on income ....... (59.7) (30.3) 423.7 12.2 411.5
Provision for losses on doubtful
accounts ................ (13.9) (17.1) (11.9) (0.5) (11.4)
Provision (benefit) for taxes on
income ................. 102.6 68.0 179.1 (12.2) 191.3
Interest expense, net of interest
income ................. 875.4 900.7 500.0 25.8 474.2
Net changes in assets and liabilities (378.7) (265.5) 297.7 293.5 4.2
EBITDA .................. $3,485.6 $3,100.7 $2,819.5 $ 43.7 $2,775.8
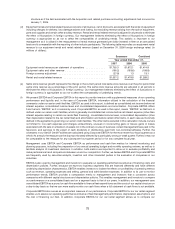
Year Ended December 31, 2007 Compared with Year Ended December 31, 2006
Revenues
Years Ended
December 31,
2007 2006 $ Change % Change
Revenues
Car rental .................................... $6,800.7 $6,273.6 $527.1 8.4%
Equipment rental ............................... 1,755.3 1,672.1 83.2 5.0%
Other ....................................... 129.6 112.7 16.9 15.0%
Total revenues ............................... $8,685.6 $8,058.4 $627.2 7.8%
Total revenues increased 7.8% for the year ended December 31, 2007 compared to the year ended
December 31, 2006.
Revenues from our car rental operations increased 8.4%, primarily as a result of a 5.0% increase in car
rental volume worldwide, the effects of foreign currency translation of approximately $179.7 million and
an increase in airport concession recovery fees of $67.1 million.
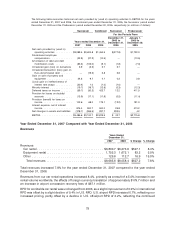
RPD for worldwide car rental was unchanged from 2006, as a slight improvement of 0.9% in international
RPD was offset by a slight decline of 0.4% in U.S. RPD. U.S. airport RPD increased 0.7%, reflecting our
increased pricing, partly offset by a decline in U.S. off-airport RPD of 2.2%, reflecting the continued
79