Hertz 2007 Annual Report Download - page 95
Download and view the complete annual report
Please find page 95 of the 2007 Hertz annual report below. You can navigate through the pages in the report by either clicking on the pages listed below, or by using the keyword search tool below to find specific information within the annual report.-
 1
1 -
2
-
3
-
4
-
5
-
6
-
7
-
8
-
9
-
10
-
11
-
12
-
13
-
14
-
15
-
16
-
17
-
18
-
19
-
20
-
21
-
22
-
23
-
24
-
25
-
26
-
27
-
28
-
29
-
30
-
31
-
32
-
33
-
34
-
35
-
36
-
37
-
38
-
39
-
40
-
41
-
42
-
43
-
44
-
45
-
46
-
47
-
48
-
49
-
50
-
51
-
52
-
53
-
54
-
55
-
56
-
57
-
58
-
59
-
60
-
61
-
62
-
63
-
64
-
65
-
66
-
67
-
68
-
69
-
70
-
71
-
72
-
73
-
74
-
75
-
76
-
77
-
78
-
79
-
80
-
81
-
82
-
83
-
84
-
 85
85 -
 86
86 -
 87
87 -
 88
88 -
 89
89 -
 90
90 -
 91
91 -
 92
92 -
 93
93 -
 94
94 -
 95
95 -
 96
96 -
 97
97 -
 98
98 -
 99
99 -
 100
100 -
 101
101 -
 102
102 -
 103
103 -
 104
104 -
 105
105 -
106
-
107
-
108
-
109
-
110
-
111
-
112
-
113
-
114
-
115
-
116
-
117
-
118
-
119
-
120
-
121
-
122
-
123
-
124
-
125
-
126
-
127
-
128
-
129
-
130
-
131
-
132
-
133
-
134
-
135
-
136
-
137
-
138
-
139
-
140
-
141
-
142
-
143
-
144
-
145
-
146
-
147
-
148
-
149
-
150
-
151
-
152
-
153
-
154
-
155
-
156
-
157
-
158
-
159
-
160
-
161
-
162
-
163
-
164
-
165
-
166
-
167
-
168
-
169
-
170
-
171
-
172
-
173
-
174
-
175
-
176
-
177
-
178
-
179
-
180
-
181
-
182
-
183
-
184
-
185
-
186
-
187
-
188
-
189
-
190
-
191
-
192
-
193
-
194
-
195
-
196
-
197
-
198
-
199
-
200
-
201
-
202
-
203
-
204
-
205
-
206
-
207
-
208
-
209
-
210
-
211
-
212
-
213
-
214
-
215
-
216
-
217
-
218
-
219
-
220
-
221
-
222
-
223
-
224
-
225
-
226
-
227
-
228
-
229
-
230
-
231
-
232
-
233
-
234
 |
 |

structure as if the debt associated with the Acquisition and related purchase accounting adjustments had occurred on
January 1, 2005.
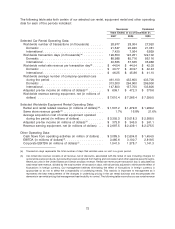
(d) Equipment rental and rental related revenue consists of all revenue, net of discounts, associated with the rental of equipment
including charges for delivery, loss damage waivers and fueling, but excluding revenue arising from the sale of equipment,
parts and supplies and certain other ancillary revenue. Rental and rental related revenue is adjusted in all periods to eliminate
the effect of fluctuations in foreign currency. Our management believes eliminating the effect of fluctuations in foreign
currency is appropriate so as not to affect the comparability of underlying trends. This statistic is important to our
management as it is utilized in the measurement of rental revenue generated per dollar invested in fleet on an annualized
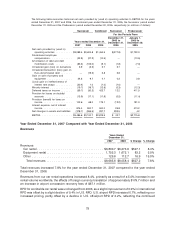
basis and is comparable with the reporting of other industry participants. The following table reconciles our equipment rental
revenue to our equipment rental and rental related revenue (based on December 31, 2006 foreign exchange rates) (in
millions of dollars):
Successor Combined
Year ended December 31,
2007 2006 2005
Equipment rental revenue per statement of operations ............ $1,755.3 $1,672.1 $1,414.9
Equipment sales and other revenue ........................ (190.2) (193.6) (158.8)
Foreign currency adjustment ............................ (27.9) 1.3 13.1
Rental and rental related revenue ......................... $1,537.2 $1,479.8 $1,269.2
(e) Same store revenue growth represents the change in the current period total same store revenue over the prior period total
same store revenue as a percentage of the prior period. The same store revenue amounts are adjusted in all periods to
eliminate the effect of fluctuations in foreign currency. Our management believes eliminating the effect of fluctuations in
foreign currency is appropriate so as not to affect the comparability of underlying trends.
(f) We present EBITDA and Corporate EBITDA in this report to provide investors with supplemental measures of our operating
performance and liquidity and, in the case of Corporate EBITDA, information utilized in the calculation of the financial
covenants under our senior credit facilities. EBITDA, as used in this report, is defined as consolidated net income before net
interest expense, consolidated income taxes and consolidated depreciation and amortization. Corporate EBITDA differs
from the term ‘‘EBITDA’’ as it is commonly used. Corporate EBITDA, as used in this report, means ‘‘EBITDA’’ as that term is
defined under our senior credit facilities, which is generally consolidated net income before net interest expense (other than
interest expense relating to certain car rental fleet financing), consolidated income taxes, consolidated depreciation (other
than depreciation related to the car rental fleet) and amortization and before certain other items, in each case as more fully
defined in the agreements governing our senior credit facilities. The other items excluded in this calculation include, but are
not limited to: non-cash expenses and charges; extraordinary, unusual or non-recurring gains or losses; gains or losses
associated with the sale or writedown of assets not in the ordinary course of business; certain management fees paid to the
Sponsors; and earnings to the extent of cash dividends or distributions paid from non-controlled affiliates. Further, the
covenants in our Senior Credit Facilities are calculated using Corporate EBITDA for the most recent four fiscal quarters as a
whole. As a result, the measure can be disproportionately affected by a particularly strong or weak quarter. Further, it may not
be comparable to the measure for any subsequent four-quarter period or for any complete fiscal year.
Management uses EBITDA and Corporate EBITDA as performance and cash flow metrics for internal monitoring and
planning purposes, including the preparation of our annual operating budget and monthly operating reviews, as well as to
facilitate analysis of investment decisions. In addition, both metrics are important to allow us to evaluate profitability and
make performance trend comparisons between us and our competitors. Further, we believe EBITDA and Corporate EBITDA
are frequently used by securities analysts, investors and other interested parties in the evaluation of companies in our
industries.
EBITDA is also used by management and investors to evaluate our operating performance exclusive of financing costs and
depreciation policies. Further, because we have two business segments that are financed differently and have different
underlying depreciation characteristics, EBITDA enables investors to isolate the effects on profitability of operating metrics
such as revenue, operating expenses and selling, general and administrative expenses. In addition to its use to monitor
performance trends, EBITDA provides a comparative metric to management and investors that is consistent across
companies with different capital structures and depreciation policies. This enables management and investors to compare
our performance on a consolidated basis and on a segment basis to that of our peers. In addition, our management uses
consolidated EBITDA as a proxy for cash flow available to finance fleet expenditures and the costs of our capital structure on
a day-to-day basis so that we can more easily monitor our cash flows when a full statement of cash flows is not available.
Corporate EBITDA also serves as an important measure of our performance. Corporate EBITDA for our car rental segment
enables us to assess our operating performance inclusive of fleet management performance, depreciation assumptions and
the cost of financing our fleet. In addition, Corporate EBITDA for our car rental segment allows us to compare our
75