Hertz 2007 Annual Report Download - page 96
Download and view the complete annual report
Please find page 96 of the 2007 Hertz annual report below. You can navigate through the pages in the report by either clicking on the pages listed below, or by using the keyword search tool below to find specific information within the annual report.-
 1
1 -
2
-
3
-
4
-
5
-
6
-
7
-
8
-
9
-
10
-
11
-
12
-
13
-
14
-
15
-
16
-
17
-
18
-
19
-
20
-
21
-
22
-
23
-
24
-
25
-
26
-
27
-
28
-
29
-
30
-
31
-
32
-
33
-
34
-
35
-
36
-
37
-
38
-
39
-
40
-
41
-
42
-
43
-
44
-
45
-
46
-
47
-
48
-
49
-
50
-
51
-
52
-
53
-
54
-
55
-
56
-
57
-
58
-
59
-
60
-
61
-
62
-
63
-
64
-
65
-
66
-
67
-
68
-
69
-
70
-
71
-
72
-
73
-
74
-
75
-
76
-
77
-
78
-
79
-
80
-
81
-
82
-
83
-
84
-
85
-
 86
86 -
 87
87 -
 88
88 -
 89
89 -
 90
90 -
 91
91 -
 92
92 -
 93
93 -
 94
94 -
 95
95 -
 96
96 -
 97
97 -
 98
98 -
 99
99 -
 100
100 -
 101
101 -
 102
102 -
 103
103 -
 104
104 -
 105
105 -
 106
106 -
107
-
108
-
109
-
110
-
111
-
112
-
113
-
114
-
115
-
116
-
117
-
118
-
119
-
120
-
121
-
122
-
123
-
124
-
125
-
126
-
127
-
128
-
129
-
130
-
131
-
132
-
133
-
134
-
135
-
136
-
137
-
138
-
139
-
140
-
141
-
142
-
143
-
144
-
145
-
146
-
147
-
148
-
149
-
150
-
151
-
152
-
153
-
154
-
155
-
156
-
157
-
158
-
159
-
160
-
161
-
162
-
163
-
164
-
165
-
166
-
167
-
168
-
169
-
170
-
171
-
172
-
173
-
174
-
175
-
176
-
177
-
178
-
179
-
180
-
181
-
182
-
183
-
184
-
185
-
186
-
187
-
188
-
189
-
190
-
191
-
192
-
193
-
194
-
195
-
196
-
197
-
198
-
199
-
200
-
201
-
202
-
203
-
204
-
205
-
206
-
207
-
208
-
209
-
210
-
211
-
212
-
213
-
214
-
215
-
216
-
217
-
218
-
219
-
220
-
221
-
222
-
223
-
224
-
225
-
226
-
227
-
228
-
229
-
230
-
231
-
232
-
233
-
234
 |
 |
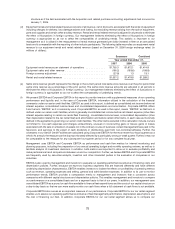
performance, inclusive of fleet mix and financing decisions, to the performance of our competitors. Since most of our
competitors utilize asset-backed fleet debt to finance fleet acquisitions, this measure is relevant for evaluating our operating
efficiency inclusive of our fleet acquisition and utilization. For our equipment rental segment, Corporate EBITDA provides an
appropriate measure of performance because the investment in our equipment fleet is longer-term in nature than for our car
rental segment and, therefore, Corporate EBITDA allows management to assess operating performance exclusive of interim
changes in depreciation assumptions. Further, unlike our car rental segment, our equipment rental fleet is not financed
through separate securitization-based fleet financing facilities, but rather through our corporate debt. Corporate EBITDA for
our equipment rental segment is a key measure used to make investment decisions because it enables us to evaluate return
on investments. For both segments, Corporate EBITDA provides a relevant profitability metric for use in comparison of our
performance against our public peers, many of whom publicly disclose a comparable metric. In addition, we believe that
investors, analysts and rating agencies consider EBITDA and Corporate EBITDA useful in measuring our ability to meet our
debt service obligations and make capital expenditures. Several of our material debt covenants are based on financial ratios
utilizing Corporate EBITDA and non-compliance with those covenants could result in the requirement to immediately repay
all amounts outstanding under those agreements, which could have a material adverse effect on our results of operations,
financial position and cash flows.
EBITDA and Corporate EBITDA are not recognized measurements under GAAP. When evaluating our operating performance
or liquidity, investors should not consider EBITDA and Corporate EBITDA in isolation of, or as a substitute for, measures of
our financial performance and liquidity as determined in accordance with GAAP, such as net income, operating income or net
cash provided by operating activities. EBITDA and Corporate EBITDA may have material limitations as performance
measures because they exclude items that are necessary elements of our costs and operations.
Because other companies may calculate EBITDA and Corporate EBITDA differently than we do, EBITDA may not be, and
Corporate EBITDA as presented in this filing is not, comparable to similarly titled measures reported by other companies.
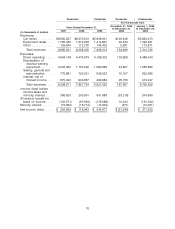
The calculation of Corporate EBITDA in the table below reflects historical financial data except for car rental fleet interest and
non-cash amortization of debt costs included in car rental fleet interest for the Predecessor period presented which have
been calculated on a pro forma basis to give effect to our new capital structure as if the fleet financings associated with the
Transactions had occurred on January 1, 2005. This calculation may not be representative of the calculation of Corporate
EBITDA under our Senior Credit Facilities for any period prior to December 31, 2006 because consolidated interest expense
(as defined in the agreements governing our senior credit facilities), a component of Corporate EBITDA, is calculated on a
transitional basis until such date. For periods prior to December 31, 2006, Corporate EBITDA under this transitional formula
would have been higher than the amount shown in the table below. Accordingly, we believe that the presentation of this
amount would be misleading to investors and have instead provided what we believe to be a more meaningful calculation of
Corporate EBITDA.
Borrowings under our Senior Credit Facilities are a key source of our liquidity. Our ability to borrow under these Senior Credit
Facilities depends upon, among other things, the maintenance of a sufficient borrowing base and compliance with the
financial ratio covenants based on Corporate EBITDA set forth in the credit agreements for our senior credit facilities. Our
senior term loan facility requires us to maintain a specified consolidated leverage ratio and consolidated interest expense
coverage ratio based on Corporate EBITDA, while our senior asset-based loan facility requires that a specified consolidated
leverage ratio and consolidated fixed charge coverage ratio be maintained for periods during which there is less than
$200 million of available borrowing capacity under the senior asset-based loan facility. These financial covenants became
applicable to us beginning September 30, 2006, reflecting the four quarter period ending thereon. Failure to comply with
these financial ratio covenants would result in a default under the credit agreements for our Senior Credit Facilities and,
absent a waiver or an amendment from the lenders, permit the acceleration of all outstanding borrowings under the senior
credit facilities. As of December 31, 2007, we performed the calculations associated with the above noted financial covenants
and determined that we are in compliance with such covenants.
As of December 31, 2007, Hertz had an aggregate principal amount outstanding of $1,386.1 million pursuant to its senior
term loan facility and $210.9 million of borrowings outstanding under its senior asset-based loan facility. For the year ended
December 31, 2007, Hertz is required under the senior term loan facility to have a consolidated leverage ratio of not more
than 5.75:1 and a consolidated interest expense coverage ratio of not less than 1.75:1. In addition, under its senior asset-
based loan facility, if there is less than $200 million of available borrowing capacity under that facility as of December 31,
2007, Hertz is required to have a consolidated leverage ratio of not more than 5.75:1 and a consolidated fixed charge
coverage ratio of not less than 1:1 for the year then ended. Under the senior term loan facility, for the year ended
December 31, 2007, we had a consolidated leverage ratio of approximately 2.9:1 and a consolidated interest expense
coverage ratio of approximately 3.7:1. Since we have maintained sufficient borrowing capacity under our senior asset-based
loan facility as of December 31, 2007, and expect to maintain such capacity in the future, the consolidated fixed charge
coverage ratio was not deemed relevant for presentation. For further information on the terms of Hertz’s senior credit
facilities, see Note 3 to the Notes to our consolidated financial statements included in this Annual Report under the caption
‘‘Item 8—Financial Statements and Supplementary Data.’’ We have a significant amount of debt. For a discussion of the risks
associated with our significant leverage, see ‘‘Item 1A—Risk Factors—Risks Relating to Our Substantial Indebtedness.’’
76