Hertz 2007 Annual Report Download - page 84
Download and view the complete annual report
Please find page 84 of the 2007 Hertz annual report below. You can navigate through the pages in the report by either clicking on the pages listed below, or by using the keyword search tool below to find specific information within the annual report.-
 1
1 -
2
-
3
-
4
-
5
-
6
-
7
-
8
-
9
-
10
-
11
-
12
-
13
-
14
-
15
-
16
-
17
-
18
-
19
-
20
-
21
-
22
-
23
-
24
-
25
-
26
-
27
-
28
-
29
-
30
-
31
-
32
-
33
-
34
-
35
-
36
-
37
-
38
-
39
-
40
-
41
-
42
-
43
-
44
-
45
-
46
-
47
-
48
-
49
-
50
-
51
-
52
-
53
-
54
-
55
-
56
-
57
-
58
-
59
-
60
-
61
-
62
-
63
-
64
-
65
-
66
-
67
-
68
-
69
-
70
-
71
-
72
-
73
-
 74
74 -
 75
75 -
 76
76 -
 77
77 -
 78
78 -
 79
79 -
 80
80 -
 81
81 -
 82
82 -
 83
83 -
 84
84 -
 85
85 -
 86
86 -
 87
87 -
 88
88 -
 89
89 -
 90
90 -
 91
91 -
 92
92 -
 93
93 -
 94
94 -
95
-
96
-
97
-
98
-
99
-
100
-
101
-
102
-
103
-
104
-
105
-
106
-
107
-
108
-
109
-
110
-
111
-
112
-
113
-
114
-
115
-
116
-
117
-
118
-
119
-
120
-
121
-
122
-
123
-
124
-
125
-
126
-
127
-
128
-
129
-
130
-
131
-
132
-
133
-
134
-
135
-
136
-
137
-
138
-
139
-
140
-
141
-
142
-
143
-
144
-
145
-
146
-
147
-
148
-
149
-
150
-
151
-
152
-
153
-
154
-
155
-
156
-
157
-
158
-
159
-
160
-
161
-
162
-
163
-
164
-
165
-
166
-
167
-
168
-
169
-
170
-
171
-
172
-
173
-
174
-
175
-
176
-
177
-
178
-
179
-
180
-
181
-
182
-
183
-
184
-
185
-
186
-
187
-
188
-
189
-
190
-
191
-
192
-
193
-
194
-
195
-
196
-
197
-
198
-
199
-
200
-
201
-
202
-
203
-
204
-
205
-
206
-
207
-
208
-
209
-
210
-
211
-
212
-
213
-
214
-
215
-
216
-
217
-
218
-
219
-
220
-
221
-
222
-
223
-
224
-
225
-
226
-
227
-
228
-
229
-
230
-
231
-
232
-
233
-
234
 |
 |
The car and equipment rental industries are significantly influenced by general economic conditions.
The car rental industry is also significantly influenced by developments in the travel industry, and,
particularly, in airline passenger traffic. Our profitability is primarily a function of the volume, mix and
pricing of rental transactions and the utilization of cars and equipment. Significant changes in the
purchase price of cars and equipment or interest rates can also have a significant effect on our
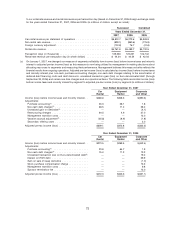
profitability depending on our ability to adjust pricing for these changes. In the United States, 2007
model year program vehicle depreciation costs rose approximately 15% and per-car depreciation costs
for 2007 model year U.S. non-program cars declined as compared to 2006. As a consequence of those
changes in per-car costs, as well as the larger proportion of our U.S. fleet we have purchased as
non-program cars and other actions we have taken to mitigate program car cost increases, our net
per-car depreciation costs for 2007 model year cars in the United States have increased by less than 3%
from our net per-car depreciation costs for 2006 model year U.S. cars. We expect 2008 model year
vehicle depreciation costs in the United States to increase between 2% to 4%. Our business requires
significant expenditures for cars and equipment, and consequently we require substantial liquidity to
finance such expenditures. See ‘‘Liquidity and Capital Resources’’ below.
Our car rental and equipment rental operations are seasonal businesses, with decreased levels of
business in the winter months and heightened activity during the spring and summer. We have the ability
to dynamically manage fleet capacity, the most significant portion of our cost structure, to meet market
demand. For instance, to accommodate increased demand, we increase our available fleet and staff
during the second and third quarters of the year. As business demand declines, fleet and staff are
decreased accordingly. A number of our other major operating costs, including airport concession fees,
commissions and vehicle liability expenses, are directly related to revenues or transaction volumes. In
addition, our management expects to utilize enhanced process improvements, including efficiency
initiatives and the use of our information systems, to help manage our variable costs. Approximately
two-thirds of our typical annual operating costs represent variable costs, while the remaining one-third
are fixed or semi-fixed. We also maintain a flexible workforce, with a significant number of part time and
seasonal workers. However, certain operating expenses, including minimum concession fees, rent,
insurance, and administrative overhead, remain fixed and cannot be adjusted for seasonal demand.
As part of our effort to implement our strategy of reducing operating costs, we are evaluating our
workforce and operations and making adjustments, including headcount reductions and process
improvements to optimize work flow at rental locations and maintenance facilities as well as streamlining
our back-office operations, initiating business process reengineering and evaluating outsourcing
opportunities. When we make adjustments to our workforce and operations, we may incur incremental
expenses that delay the benefit of a more efficient workforce and operating structure, but we believe that
increasing our operating efficiency and reducing the costs associated with the operation of our business
are important to our long-term competitiveness.
On January 5, 2007, we announced the first in a series of initiatives to further improve our
competitiveness through targeted job reductions affecting approximately 200 employees primarily at our
corporate headquarters in Park Ridge, New Jersey and our U.S. service center in Oklahoma City,
Oklahoma. These reductions are expected to result in annualized savings of up to $15.8 million.
On February 28, 2007, we announced the second initiative to further improve our competitiveness and
industry leadership through targeted job reductions affecting approximately 1,350 employees primarily
in our U.S. car rental operations, with much smaller reductions occurring in our U.S. equipment rental
operations, the corporate headquarters in Park Ridge, New Jersey, and the U.S. service center in
Oklahoma City, Oklahoma, as well as in Canada, Puerto Rico, Brazil, Australia and New Zealand. These
reductions are expected to result in annualized savings of up to $125.0 million.
On June 1, 2007, we announced the third initiative to further improve our operational efficiency through
targeted reductions affecting approximately 480 positions in our U.S. car and equipment rental
64