Hertz 2007 Annual Report Download - page 102
Download and view the complete annual report
Please find page 102 of the 2007 Hertz annual report below. You can navigate through the pages in the report by either clicking on the pages listed below, or by using the keyword search tool below to find specific information within the annual report.-
 1
1 -
2
-
3
-
4
-
5
-
6
-
7
-
8
-
9
-
10
-
11
-
12
-
13
-
14
-
15
-
16
-
17
-
18
-
19
-
20
-
21
-
22
-
23
-
24
-
25
-
26
-
27
-
28
-
29
-
30
-
31
-
32
-
33
-
34
-
35
-
36
-
37
-
38
-
39
-
40
-
41
-
42
-
43
-
44
-
45
-
46
-
47
-
48
-
49
-
50
-
51
-
52
-
53
-
54
-
55
-
56
-
57
-
58
-
59
-
60
-
61
-
62
-
63
-
64
-
65
-
66
-
67
-
68
-
69
-
70
-
71
-
72
-
73
-
74
-
75
-
76
-
77
-
78
-
79
-
80
-
81
-
82
-
83
-
84
-
85
-
86
-
87
-
88
-
89
-
90
-
91
-
 92
92 -
 93
93 -
 94
94 -
 95
95 -
 96
96 -
 97
97 -
 98
98 -
 99
99 -
 100
100 -
 101
101 -
 102
102 -
 103
103 -
 104
104 -
 105
105 -
 106
106 -
 107
107 -
 108
108 -
 109
109 -
 110
110 -
 111
111 -
 112
112 -
113
-
114
-
115
-
116
-
117
-
118
-
119
-
120
-
121
-
122
-
123
-
124
-
125
-
126
-
127
-
128
-
129
-
130
-
131
-
132
-
133
-
134
-
135
-
136
-
137
-
138
-
139
-
140
-
141
-
142
-
143
-
144
-
145
-
146
-
147
-
148
-
149
-
150
-
151
-
152
-
153
-
154
-
155
-
156
-
157
-
158
-
159
-
160
-
161
-
162
-
163
-
164
-
165
-
166
-
167
-
168
-
169
-
170
-
171
-
172
-
173
-
174
-
175
-
176
-
177
-
178
-
179
-
180
-
181
-
182
-
183
-
184
-
185
-
186
-
187
-
188
-
189
-
190
-
191
-
192
-
193
-
194
-
195
-
196
-
197
-
198
-
199
-
200
-
201
-
202
-
203
-
204
-
205
-
206
-
207
-
208
-
209
-
210
-
211
-
212
-
213
-
214
-
215
-
216
-
217
-
218
-
219
-
220
-
221
-
222
-
223
-
224
-
225
-
226
-
227
-
228
-
229
-
230
-
231
-
232
-
233
-
234
 |
 |

Net Income
Net income increased 128.2% primarily due to higher rental volume in our worldwide car and equipment
rental operations, partly offset by higher fleet costs, as well as the net effect of other contributing factors
noted above. The impact of changes in exchange rates on net income was mitigated by the fact that not
only foreign revenues but also most foreign expenses were incurred in local currencies.
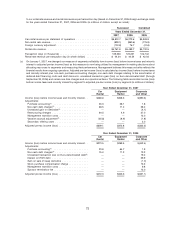
Effects of Acquisition
The following table summarizes the purchase accounting effects of the Acquisition on our results of
operations for the year ended December 31, 2007 (in millions of dollars):
Depreciation and amortization of tangible and intangible assets:
Other intangible assets ................................................ $ 61.2
Revenue earning equipment ............................................ 19.8
Property and equipment ............................................... 7.8
Accretion of revalued liabilities:
Discount on debt .................................................... 7.0
Workers’ compensation and public liability and property damage ................. 5.5
$101.3
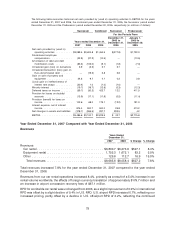
Year Ended December 31, 2006 Compared with Year Ended December 31, 2005 (Combined)
Revenues
Total revenues of $8,058.4 million for the year ended December 31, 2006 increased by 7.9% from
$7,469.2 million for the year ended December 31, 2005.
Revenues from our car rental operations of $6,273.6 million for the year ended December 31, 2006
increased by $323.7 million, or 5.4%, from $5,949.9 million for the year ended December 31, 2005. The
increase was primarily the result of a 1.1% increase in car rental volume worldwide, a 2.7% increase in
pricing worldwide, increases in airport concession recovery and refueling fees, license and tax
reimbursement fees and the effects of foreign currency translation of approximately $36.4 million.
Revenues from our equipment rental operations of $1,672.1 million for the year ended December 31,
2006 increased by $257.2 million, or 18.2%, from $1,414.9 million for the year ended December 31,
2005. The increase was primarily due to higher rental volume and improved pricing in the United States
and Canada and the effects of foreign currency translation of approximately $18.9 million.
Revenues from all other sources of $112.7 million for the year ended December 31, 2006 increased by
$8.3 million, or 7.9%, from $104.4 million for the year ended December 31, 2005, primarily due to the
increase in car rental licensee revenue and the effects of foreign currency translation.
Expenses
Total expenses of $7,857.8 million for the year ended December 31, 2006 increased by 13.4% from
$6,927.5 million for the year ended December 31, 2005 and total expenses as a percentage of revenues
increased to 97.5% for the year ended December 31, 2006 compared with 92.7% for the year ended
December 31, 2005.
Direct operating expenses of $4,476.0 million for the year ended December 31, 2006 increased by
$286.7 million, or 6.8%, from $4,189.3 million for the year ended December 31, 2005. The increase was
the result of increases in personnel related expenses, fleet related expenses and other direct operating
expenses.
82