Hertz 2007 Annual Report Download - page 101
Download and view the complete annual report
Please find page 101 of the 2007 Hertz annual report below. You can navigate through the pages in the report by either clicking on the pages listed below, or by using the keyword search tool below to find specific information within the annual report.-
 1
1 -
2
-
3
-
4
-
5
-
6
-
7
-
8
-
9
-
10
-
11
-
12
-
13
-
14
-
15
-
16
-
17
-
18
-
19
-
20
-
21
-
22
-
23
-
24
-
25
-
26
-
27
-
28
-
29
-
30
-
31
-
32
-
33
-
34
-
35
-
36
-
37
-
38
-
39
-
40
-
41
-
42
-
43
-
44
-
45
-
46
-
47
-
48
-
49
-
50
-
51
-
52
-
53
-
54
-
55
-
56
-
57
-
58
-
59
-
60
-
61
-
62
-
63
-
64
-
65
-
66
-
67
-
68
-
69
-
70
-
71
-
72
-
73
-
74
-
75
-
76
-
77
-
78
-
79
-
80
-
81
-
82
-
83
-
84
-
85
-
86
-
87
-
88
-
89
-
90
-
 91
91 -
 92
92 -
 93
93 -
 94
94 -
 95
95 -
 96
96 -
 97
97 -
 98
98 -
 99
99 -
 100
100 -
 101
101 -
 102
102 -
 103
103 -
 104
104 -
 105
105 -
 106
106 -
 107
107 -
 108
108 -
 109
109 -
 110
110 -
 111
111 -
112
-
113
-
114
-
115
-
116
-
117
-
118
-
119
-
120
-
121
-
122
-
123
-
124
-
125
-
126
-
127
-
128
-
129
-
130
-
131
-
132
-
133
-
134
-
135
-
136
-
137
-
138
-
139
-
140
-
141
-
142
-
143
-
144
-
145
-
146
-
147
-
148
-
149
-
150
-
151
-
152
-
153
-
154
-
155
-
156
-
157
-
158
-
159
-
160
-
161
-
162
-
163
-
164
-
165
-
166
-
167
-
168
-
169
-
170
-
171
-
172
-
173
-
174
-
175
-
176
-
177
-
178
-
179
-
180
-
181
-
182
-
183
-
184
-
185
-
186
-
187
-
188
-
189
-
190
-
191
-
192
-
193
-
194
-
195
-
196
-
197
-
198
-
199
-
200
-
201
-
202
-
203
-
204
-
205
-
206
-
207
-
208
-
209
-
210
-
211
-
212
-
213
-
214
-
215
-
216
-
217
-
218
-
219
-
220
-
221
-
222
-
223
-
224
-
225
-
226
-
227
-
228
-
229
-
230
-
231
-
232
-
233
-
234
 |
 |

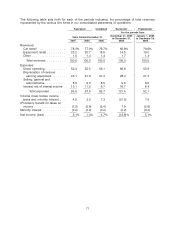
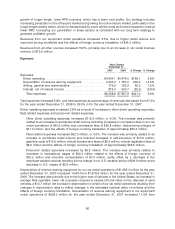
$277.6 million for the year ended December 31, 2006. The increase was primarily due to an increase in
the quantity of equipment operated, as well as lower net proceeds received in excess of book value on
the disposal of used equipment, partly offset by a $13.1 million net decrease in depreciation in certain of
our equipment rental operations resulting from changes in depreciation rates to reflect changes in the
estimated residual value of equipment.
Selling, general and administrative expenses increased 7.2%, primarily due to increases in
administrative and advertising expenses and the effects of foreign currency translation of approximately
$25.7 million. Administrative expenses increased $26.5 million primarily due to restructuring charges of
$55.3 million, increases in stock-based employee compensation expense of $16.3 million, pension costs
of $3.6 million and management incentive compensation of $2.9 million, partly offset by foreign currency
transaction losses of $19.2 million associated with our Euro-denominated debt in 2006, stock purchase
compensation expense of $13.3 million in 2006 relating to the purchase of stock by our Chief Executive
Officer, a decrease in consultant fees of $9.7 million, an increase in the unrealized gain on our HIL
swaptions of $6.4 million and a decrease in the employee vacation accrual resulting from a change in our
U.S. vacation policy of $6.4 million. Additionally, advertising expenses increased $22.8 million primarily
due to expanded media advertising, primarily in television.
Interest expense, net of interest income, decreased 2.8%, primarily due to a decrease in the weighted
average debt outstanding, partly offset by an increase in the weighted average interest rate, expenses
related to the current year ineffectiveness of our HVF swaps of $20.4 million and the write-off in 2007 of
$16.2 million in unamortized debt costs associated with the debt modification.
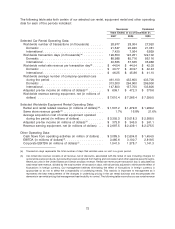
Adjusted Pre-Tax Income (Loss)
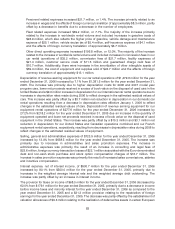
Adjusted pre-tax income for our car rental segment of $609.1 million increased 29.0% from
$472.3 million for the year ended December 31, 2006. The increase was primarily due to transaction day
improvement and lower total expenses as a percentage of revenues. Adjusted pre-tax income for our
equipment rental segment of $373.8 million increased 8.2% from $345.5 million for the year ended
December 31, 2006. The increase was primarily due to increased rental volumes and lower total
expenses as a percentage of revenues. Adjusted pre-tax loss for ‘‘Corporate and other’’ of $322.2 million
decreased 2.7% from $331.1 million for the year ended December 31, 2006. The decrease was primarily
due to a decrease in interest expense, partly offset by an increase in selling, general and administrative
expenses.
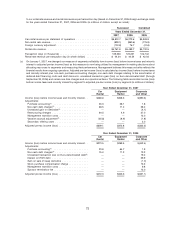
Years Ended
December 31,
2007 2006 $ Change % Change
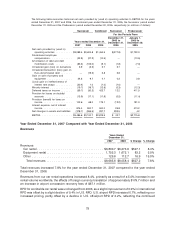
Income before income taxes and minority interest ........... $386.8 $200.6 $186.2 92.8%
Provision for taxes on income ......................... (102.6) (68.0) (34.6) 50.9%
Minority interest ................................... (19.7) (16.7) (3.0) 17.8%
Net income ...................................... $264.5 $115.9 $148.6 128.2%
Provision for Taxes on Income and Minority Interest
The provision for taxes on income increased 50.9%, primarily due to an increase in income before taxes
and minority interest. The effective tax rate for 2007 decreased to 26.5% from 33.9% in 2006, primarily
due to a net reduction in the global valuation allowance and a reduction to the net deferred tax liability
attributable to decreases in statutory income tax rates in various jurisdictions. See Note 7 to the Notes to
our consolidated financial statements included in this Annual Report under the caption ‘‘Item 8—
Financial Statements and Supplementary Data.’’
Minority interest increased 17.8% primarily due to an increase in our majority-owned subsidiary
Navigation Solutions, L.L.C.’s net income in 2007 as compared to 2006.
81