Hertz 2007 Annual Report Download - page 97
Download and view the complete annual report
Please find page 97 of the 2007 Hertz annual report below. You can navigate through the pages in the report by either clicking on the pages listed below, or by using the keyword search tool below to find specific information within the annual report.-
 1
1 -
2
-
3
-
4
-
5
-
6
-
7
-
8
-
9
-
10
-
11
-
12
-
13
-
14
-
15
-
16
-
17
-
18
-
19
-
20
-
21
-
22
-
23
-
24
-
25
-
26
-
27
-
28
-
29
-
30
-
31
-
32
-
33
-
34
-
35
-
36
-
37
-
38
-
39
-
40
-
41
-
42
-
43
-
44
-
45
-
46
-
47
-
48
-
49
-
50
-
51
-
52
-
53
-
54
-
55
-
56
-
57
-
58
-
59
-
60
-
61
-
62
-
63
-
64
-
65
-
66
-
67
-
68
-
69
-
70
-
71
-
72
-
73
-
74
-
75
-
76
-
77
-
78
-
79
-
80
-
81
-
82
-
83
-
84
-
85
-
86
-
 87
87 -
 88
88 -
 89
89 -
 90
90 -
 91
91 -
 92
92 -
 93
93 -
 94
94 -
 95
95 -
 96
96 -
 97
97 -
 98
98 -
 99
99 -
 100
100 -
 101
101 -
 102
102 -
 103
103 -
 104
104 -
 105
105 -
 106
106 -
 107
107 -
108
-
109
-
110
-
111
-
112
-
113
-
114
-
115
-
116
-
117
-
118
-
119
-
120
-
121
-
122
-
123
-
124
-
125
-
126
-
127
-
128
-
129
-
130
-
131
-
132
-
133
-
134
-
135
-
136
-
137
-
138
-
139
-
140
-
141
-
142
-
143
-
144
-
145
-
146
-
147
-
148
-
149
-
150
-
151
-
152
-
153
-
154
-
155
-
156
-
157
-
158
-
159
-
160
-
161
-
162
-
163
-
164
-
165
-
166
-
167
-
168
-
169
-
170
-
171
-
172
-
173
-
174
-
175
-
176
-
177
-
178
-
179
-
180
-
181
-
182
-
183
-
184
-
185
-
186
-
187
-
188
-
189
-
190
-
191
-
192
-
193
-
194
-
195
-
196
-
197
-
198
-
199
-
200
-
201
-
202
-
203
-
204
-
205
-
206
-
207
-
208
-
209
-
210
-
211
-
212
-
213
-
214
-
215
-
216
-
217
-
218
-
219
-
220
-
221
-
222
-
223
-
224
-
225
-
226
-
227
-
228
-
229
-
230
-
231
-
232
-
233
-
234
 |
 |

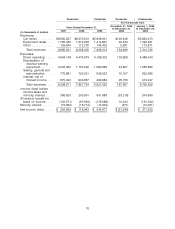
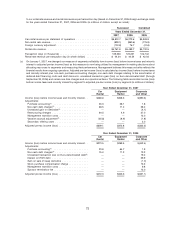
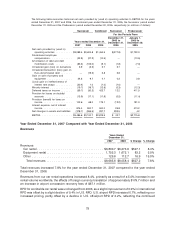
The following table reconciles historical net income (loss) (i) to Corporate EBITDA on an actual basis for the Successor years
ended December 31, 2007 and 2006 and the Successor period ended December 31, 2005 and (ii) to Corporate EBITDA on a
pro forma basis, as it relates to car rental fleet interest and non-cash amortization of debt costs, for the combined year ended
December 31, 2005 and the Predecessor period ended December 20, 2005 (in millions of dollars):
Successor Combined Successor Predecessor
For the Periods From
December 21, January 1,
2005 to 2005 to
Years ended December 31, December 31, December 20,
2007 2006 2005 2005 2005
Net income (loss)(1) ................ $ 264.5 $ 115.9 $ 350.0 $(21.3) $ 371.3
Depreciation and amortization(2) ...... 2,243.1 2,016.1 1,790.4 51.4 1,739.0
Interest, net of interest income(1)(3) ..... 875.4 900.7 500.0 25.8 474.2
Provision (benefit) for taxes on income . . . 102.6 68.0 179.1 (12.2) 191.3
EBITDA ....................... 3,485.6 3,100.7 2,819.5 43.7 2,775.8
Adjustments:
Car rental fleet interest(4) ........... (427.8) (400.0) (406.9) (11.7) (395.2)
Car rental fleet depreciation(5) ........ (1,695.4) (1,479.6) (1,381.5) (37.4) (1,344.1)
Non-cash expenses and charges(6) .... 102.2 130.6 106.2 2.5 103.7
Extraordinary, unusual or non-recurring
gains or losses(7) .............. 76.9 23.8 4.0 — 4.0
Sponsors’ fees ................. — 3.2 — — —
Corporate EBITDA(8) ............... $1,541.5 $ 1,378.7 $ 1,141.3 $ (2.9) $ 1,144.2
(1) For the year ended December 31, 2007, includes corporate audit and legal fees of $0.4 million, secondary offering costs
of $2.0 million and $0.4 million of interest income attributable to Hertz Holdings. For the year ended December 31, 2006,
includes corporate audit fees of $0.1 million and $40.0 million ($26.0 million net of tax), of interest expense attributable
to Hertz Holdings. For the year ended December 31, 2007 and 2006, the Successor period ended December 31, 2005
and the Predecessor period ended December 20, 2005, includes corporate minority interest of $19.7 million,
$16.7 million, $0.3 million and $12.3 million, respectively.
(2) For the years ended December 31, 2007 and 2006, the Successor period ended December 31, 2005 and the
Predecessor period ended December 20, 2005, depreciation and amortization was $1,856.6 million, $1,659.8 million,
$42.6 million and $1,485.9 million, respectively, in our car rental segment and $380.6 million, $350.3 million, $8.6 million
and $248.2 million, respectively, in our equipment rental segment.
(3) For the years ended December 31, 2007 and 2006, the Successor period ended December 31, 2005 and the
Predecessor period ended December 20, 2005, interest, net of interest income was $436.8 million, $424.1 million,
$15.8 million, and $349.2 million, respectively, in our car rental segment and $146.3 million, $140.0 million, $3.4 million
and $86.4 million, respectively, in our equipment rental segment.
(4) As defined in the credit agreements governing our senior credit facilities, Corporate EBITDA includes a reduction for
certain car rental fleet related interest. For the Predecessor period presented, car rental fleet interest has been
calculated on a pro forma basis to give effect to the U.S. and international fleet debt financings entered into as part of the
Transactions as if they had occurred on January 1, 2005. For the Successor periods presented, car rental fleet interest is
based on actual results.
(5) As defined in the credit agreements governing our senior credit facilities, Corporate EBITDA includes a reduction for car
rental fleet depreciation. For all periods presented, car rental fleet depreciation does not vary from the historical
amounts.
(6) For the years ended December 31, 2007 and 2006, the Successor period ended December 31, 2005 and the
Predecessor period ended December 20, 2005, non-cash expenses and charges were $64.2 million, $73.0 million,
$2.5 million and $92.4 million, respectively, in our car rental segment and $2.7 million, $(0.4) million, $0.0 million and
$1.0 million, respectively, in our equipment rental segment.
As defined in the credit agreements governing our senior credit facilities, Corporate EBITDA excludes the impact of
certain non-cash expenses and charges. For the Successor periods presented, non-cash amortization of debt costs
included in car rental fleet interest is based on actual results. For the Predecessor period ended December 20, 2005,
non-cash amortization of debt costs included in car rental fleet interest has been calculated on a pro forma basis to give
77