Hertz 2007 Annual Report Download - page 104
Download and view the complete annual report
Please find page 104 of the 2007 Hertz annual report below. You can navigate through the pages in the report by either clicking on the pages listed below, or by using the keyword search tool below to find specific information within the annual report.-
 1
1 -
2
-
3
-
4
-
5
-
6
-
7
-
8
-
9
-
10
-
11
-
12
-
13
-
14
-
15
-
16
-
17
-
18
-
19
-
20
-
21
-
22
-
23
-
24
-
25
-
26
-
27
-
28
-
29
-
30
-
31
-
32
-
33
-
34
-
35
-
36
-
37
-
38
-
39
-
40
-
41
-
42
-
43
-
44
-
45
-
46
-
47
-
48
-
49
-
50
-
51
-
52
-
53
-
54
-
55
-
56
-
57
-
58
-
59
-
60
-
61
-
62
-
63
-
64
-
65
-
66
-
67
-
68
-
69
-
70
-
71
-
72
-
73
-
74
-
75
-
76
-
77
-
78
-
79
-
80
-
81
-
82
-
83
-
84
-
85
-
86
-
87
-
88
-
89
-
90
-
91
-
92
-
93
-
 94
94 -
 95
95 -
 96
96 -
 97
97 -
 98
98 -
 99
99 -
 100
100 -
 101
101 -
 102
102 -
 103
103 -
 104
104 -
 105
105 -
 106
106 -
 107
107 -
 108
108 -
 109
109 -
 110
110 -
 111
111 -
 112
112 -
 113
113 -
 114
114 -
115
-
116
-
117
-
118
-
119
-
120
-
121
-
122
-
123
-
124
-
125
-
126
-
127
-
128
-
129
-
130
-
131
-
132
-
133
-
134
-
135
-
136
-
137
-
138
-
139
-
140
-
141
-
142
-
143
-
144
-
145
-
146
-
147
-
148
-
149
-
150
-
151
-
152
-
153
-
154
-
155
-
156
-
157
-
158
-
159
-
160
-
161
-
162
-
163
-
164
-
165
-
166
-
167
-
168
-
169
-
170
-
171
-
172
-
173
-
174
-
175
-
176
-
177
-
178
-
179
-
180
-
181
-
182
-
183
-
184
-
185
-
186
-
187
-
188
-
189
-
190
-
191
-
192
-
193
-
194
-
195
-
196
-
197
-
198
-
199
-
200
-
201
-
202
-
203
-
204
-
205
-
206
-
207
-
208
-
209
-
210
-
211
-
212
-
213
-
214
-
215
-
216
-
217
-
218
-
219
-
220
-
221
-
222
-
223
-
224
-
225
-
226
-
227
-
228
-
229
-
230
-
231
-
232
-
233
-
234
 |
 |

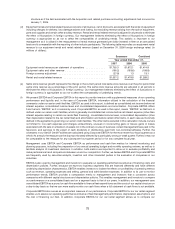
countries and the establishment of certain federal and state contingencies for the year ended
December 31, 2006 and the reversal of a valuation allowance on foreign tax credit carryforwards of
$35.0 million and favorable foreign tax adjustments of $5.3 million for the year ended December 31,
2005. The effective tax rate for the year ended December 31, 2006 was 33.9% as compared to 33.1% for
the year ended December 31, 2005. See Note 7 to the Notes to our consolidated financial statements
included in this Annual Report under the caption ‘‘Item 8—Financial Statements and Supplementary
Data.’’
Minority interest of $16.7 million for the year ended December 31, 2006 increased $4.1 million from
$12.6 million for the year ended December 31, 2005. The increase was due to an increase in our
majority-owned subsidiary Navigation Solutions, L.L.C.’s net income in the year ended December 31,
2006.
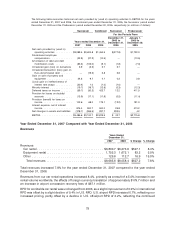
Net Income
We had net income of $115.9 million for the year ended December 31, 2006, representing a decrease of
$234.1 million, or 66.9%, from $350.0 million for the year ended December 31, 2005. The decrease in net
income was primarily due to the 80.1% increase in interest expense over the year ended December 31,
2005, as well as the net effect of other contributing factors noted above. The impact of changes in
exchange rates on net income was mitigated by the fact that not only foreign revenues but also most
foreign expenses were incurred in local currencies.
Effects of Acquisition
Increased interest expense resulting from our higher debt levels and increased depreciation and
amortization expense resulting from the revaluation of our tangible assets and the recognition of certain
identified intangible assets, all in connection with the Acquisition, had a significant adverse impact on full
year 2006 income before income taxes and minority interest.
The following table summarizes the purchase accounting effects of the Acquisition on our results of
operations for the year ended December 31, 2006 (in millions of dollars):
Depreciation and amortization of tangible and intangible assets:
Other intangible assets ................................................. $61.2
Revenue earning equipment ............................................. 13.8
Property and equipment ................................................ 10.0
Accretion of revalued liabilities:
Discount on debt ..................................................... 8.8
Workers’ compensation and public liability and property damage .................. 5.4
$99.2
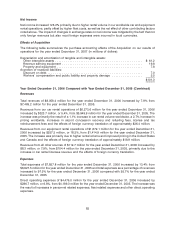
Liquidity and Capital Resources
As of December 31, 2007, we had cash and equivalents of $730.2 million, an increase of $55.7 million
from December 31, 2006. As of December 31, 2007, we had $661.0 million of restricted cash to be used
for the purchase of revenue earning vehicles and other specified uses under our Fleet Debt facilities, our
like-kind exchange programs and to satisfy certain of our self-insurance regulatory reserve
requirements.
Our domestic and foreign operations are funded by cash provided by operating activities and by
extensive financing arrangements maintained by us in the United States, Europe, Puerto Rico, Australia,
New Zealand, Canada and Brazil. Net cash provided by operating activities during the year ended
December 31, 2007 was $3,089.5 million, an increase of $484.7 million from the year ended
December 31, 2006. This increase was primarily due to a year-over-year improvements in working
capital and net income.
84