Hertz 2007 Annual Report Download - page 232
Download and view the complete annual report
Please find page 232 of the 2007 Hertz annual report below. You can navigate through the pages in the report by either clicking on the pages listed below, or by using the keyword search tool below to find specific information within the annual report.-
 1
1 -
2
-
3
-
4
-
5
-
6
-
7
-
8
-
9
-
10
-
11
-
12
-
13
-
14
-
15
-
16
-
17
-
18
-
19
-
20
-
21
-
22
-
23
-
24
-
25
-
26
-
27
-
28
-
29
-
30
-
31
-
32
-
33
-
34
-
35
-
36
-
37
-
38
-
39
-
40
-
41
-
42
-
43
-
44
-
45
-
46
-
47
-
48
-
49
-
50
-
51
-
52
-
53
-
54
-
55
-
56
-
57
-
58
-
59
-
60
-
61
-
62
-
63
-
64
-
65
-
66
-
67
-
68
-
69
-
70
-
71
-
72
-
73
-
74
-
75
-
76
-
77
-
78
-
79
-
80
-
81
-
82
-
83
-
84
-
85
-
86
-
87
-
88
-
89
-
90
-
91
-
92
-
93
-
94
-
95
-
96
-
97
-
98
-
99
-
100
-
101
-
102
-
103
-
104
-
105
-
106
-
107
-
108
-
109
-
110
-
111
-
112
-
113
-
114
-
115
-
116
-
117
-
118
-
119
-
120
-
121
-
122
-
123
-
124
-
125
-
126
-
127
-
128
-
129
-
130
-
131
-
132
-
133
-
134
-
135
-
136
-
137
-
138
-
139
-
140
-
141
-
142
-
143
-
144
-
145
-
146
-
147
-
148
-
149
-
150
-
151
-
152
-
153
-
154
-
155
-
156
-
157
-
158
-
159
-
160
-
161
-
162
-
163
-
164
-
165
-
166
-
167
-
168
-
169
-
170
-
171
-
172
-
173
-
174
-
175
-
176
-
177
-
178
-
179
-
180
-
181
-
182
-
183
-
184
-
185
-
186
-
187
-
188
-
189
-
190
-
191
-
192
-
193
-
194
-
195
-
196
-
197
-
198
-
199
-
200
-
201
-
202
-
203
-
204
-
205
-
206
-
207
-
208
-
209
-
210
-
211
-
212
-
213
-
214
-
215
-
216
-
217
-
218
-
219
-
220
-
221
-
 222
222 -
 223
223 -
 224
224 -
 225
225 -
 226
226 -
 227
227 -
 228
228 -
 229
229 -
 230
230 -
 231
231 -
 232
232 -
 233
233 -
 234
234
 |
 |

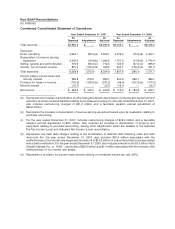
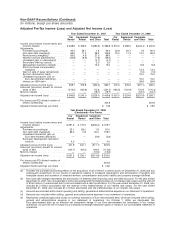
Non-GAAP Reconciliations (Continued)
(In millions)
Reconciliation from Operating Cash Flows to EBITDA:
Years ended December 31,
(Combined)
Actual
2007 2006 2005
Net cash provided by operating activities .................. $3,089.5 $2,604.8 $1,454.5
Stock-based employee compensation ................... (32.9) (27.2) (10.5)
Amortization of debt and debt modification costs ........... (85.3) (105.0) (9.1)
Unrealized gain (loss) on derivatives .................... 3.9 (2.5) 2.7
Unrealized transaction (gain) loss on Euro-denominated debt . . — (19.2) 2.8
Gain on sale of property and equipment ................. 24.8 9.7 4.1
(Loss) gain on ineffectiveness of interest rate swaps ........ (20.4) 1.0 (1.0)
Minority interest .................................. (19.7) (16.7) (12.6)
Deferred taxes on income ........................... (59.7) (30.3) 423.7
Provision for losses on doubtful accounts ................ (13.9) (17.1) (11.9)
Provision for taxes on income ........................ 102.6 68.0 179.1
Interest expense, net of interest income ................. 875.4 900.7 500.0
Net changes in assets and liabilities .................... (378.7) (265.5) 297.7
EBITDA .......................................... $3,485.6 $3,100.7 $2,819.5
Net Corporate Debt & Net Fleet Debt
December 31, December 31, December 31,
2007 2006 2005
Corporate Debt
Debt, less: .................................. $11,960.1 $12,276.2 $12,515.0
U.S. Fleet Debt and Pre-Acquisition Notes .......... 4,603.5 4,845.2 4,920.2
International Fleet Debt ....................... 1,912.4 1,987.8 1,831.7
U.K. Leveraged Financing ..................... 222.7 — —
Fleet Financing Facility ....................... 170.4 165.9 —
Canadian Fleet Financing Facility ................ 155.4 — —
Other International Facilities .................... 92.9 — —
Fleet Debt ............................... $ 7,157.3 $ 6,998.9 $ 6,751.9
Corporate Debt ........................... $ 4,802.8 $ 5,277.3 $ 5,763.1
Corporate Restricted Cash
Restricted Cash, less: .......................... $ 661.0 $ 552.5 $ 289.2
Restricted Cash Associated with Fleet Debt ......... (573.1) (487.0) (191.5)
Corporate Restricted Cash .................. $ 87.9 $ 65.5 $ 97.7
Net Corporate Debt
Corporate Debt, less: .......................... $ 4,802.8 $ 5,277.3 $ 5,763.1
Cash and Equivalents ........................ (730.2) (674.5) (843.9)
Corporate Restricted Cash ..................... (87.9) (65.5) (97.7)
Net Corporate Debt ....................... $ 3,984.7 $ 4,537.3 $ 4,821.5
Net Fleet Debt
Fleet Debt, less: .............................. $ 7,157.3 $ 6,998.9 $ 6,751.9
Restricted Cash Associated with Fleet Debt ......... (573.1) (487.0) (191.5)
Net Fleet Debt ........................... $ 6,584.2 $ 6,511.9 $ 6,560.4