Hertz 2007 Annual Report Download - page 103
Download and view the complete annual report
Please find page 103 of the 2007 Hertz annual report below. You can navigate through the pages in the report by either clicking on the pages listed below, or by using the keyword search tool below to find specific information within the annual report.-
 1
1 -
2
-
3
-
4
-
5
-
6
-
7
-
8
-
9
-
10
-
11
-
12
-
13
-
14
-
15
-
16
-
17
-
18
-
19
-
20
-
21
-
22
-
23
-
24
-
25
-
26
-
27
-
28
-
29
-
30
-
31
-
32
-
33
-
34
-
35
-
36
-
37
-
38
-
39
-
40
-
41
-
42
-
43
-
44
-
45
-
46
-
47
-
48
-
49
-
50
-
51
-
52
-
53
-
54
-
55
-
56
-
57
-
58
-
59
-
60
-
61
-
62
-
63
-
64
-
65
-
66
-
67
-
68
-
69
-
70
-
71
-
72
-
73
-
74
-
75
-
76
-
77
-
78
-
79
-
80
-
81
-
82
-
83
-
84
-
85
-
86
-
87
-
88
-
89
-
90
-
91
-
92
-
 93
93 -
 94
94 -
 95
95 -
 96
96 -
 97
97 -
 98
98 -
 99
99 -
 100
100 -
 101
101 -
 102
102 -
 103
103 -
 104
104 -
 105
105 -
 106
106 -
 107
107 -
 108
108 -
 109
109 -
 110
110 -
 111
111 -
 112
112 -
 113
113 -
114
-
115
-
116
-
117
-
118
-
119
-
120
-
121
-
122
-
123
-
124
-
125
-
126
-
127
-
128
-
129
-
130
-
131
-
132
-
133
-
134
-
135
-
136
-
137
-
138
-
139
-
140
-
141
-
142
-
143
-
144
-
145
-
146
-
147
-
148
-
149
-
150
-
151
-
152
-
153
-
154
-
155
-
156
-
157
-
158
-
159
-
160
-
161
-
162
-
163
-
164
-
165
-
166
-
167
-
168
-
169
-
170
-
171
-
172
-
173
-
174
-
175
-
176
-
177
-
178
-
179
-
180
-
181
-
182
-
183
-
184
-
185
-
186
-
187
-
188
-
189
-
190
-
191
-
192
-
193
-
194
-
195
-
196
-
197
-
198
-
199
-
200
-
201
-
202
-
203
-
204
-
205
-
206
-
207
-
208
-
209
-
210
-
211
-
212
-
213
-
214
-
215
-
216
-
217
-
218
-
219
-
220
-
221
-
222
-
223
-
224
-
225
-
226
-
227
-
228
-
229
-
230
-
231
-
232
-
233
-
234
 |
 |
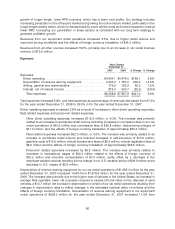
Personnel related expenses increased $21.7 million, or 1.4%. The increase primarily related to an
increase in wages and the effects of foreign currency translation of approximately $8.3 million, partly
offset by a decrease in benefits due to a decrease in the number of employees.
Fleet related expenses increased $69.2 million, or 7.1%. The majority of the increase primarily
related to the increase in worldwide rental volume and included increases in gasoline costs of
$28.9 million, which also reflects the higher price of gasoline, vehicle damage and maintenance
expense of $25.1 million, vehicle excise tax of $5.4 million, self-insurance expense of $4.1 million
and the effects of foreign currency translation of approximately $8.7 million.
Other direct operating expenses increased $195.8 million, or 12.0%. The majority of the increase
related to the increase in worldwide rental volume and included increases in concession fees in our
car rental operations of $35.2 million, commission fees of $21.7 million, facility expenses of
$21.4 million, customer service costs of $11.5 million and guaranteed charge card fees of
$10.7 million. Additionally, there were increases in the amortization of other intangible assets of
$59.4 million, the cost of equipment and supplies sold of $24.7 million and the effects of foreign
currency translation of approximately $13.1 million.
Depreciation of revenue earning equipment for our car rental operations of $1,479.6 million for the year
ended December 31, 2006 increased by 7.1% from $1,381.5 million for the year ended December 31,
2005. The increase was primarily due to higher depreciation costs for 2006 and 2007 model year
program cars, lower net proceeds received in excess of book value on the disposal of used cars in the
United States and a $9.0 million increase in depreciation for our international car rental operations due to
increases in depreciation rates made during 2006 to reflect changes in the estimated residual values of
cars. This increase was partly offset by a $3.7 million net reduction in depreciation in our domestic car
rental operations resulting from a decrease in depreciation rates effective January 1, 2006 to reflect
changes in the estimated residual values of cars. Depreciation of revenue earning equipment for our
equipment rental operations of $277.6 million for the year ended December 31, 2006 increased by
27.2% from $218.2 million for the year ended December 31, 2005 due an increase in the quantity of
equipment operated and lower net proceeds received in excess of book value on the disposal of used
equipment in the United States. This increase was partly offset by a $15.3 million and $3.1 million net
reduction in depreciation for our United States and Canadian operations combined and our French
equipment rental operations, respectively, resulting from decreases in depreciation rates during 2006 to
reflect changes in the estimated residual values of equipment.
Selling, general and administrative expenses of $723.9 million for the year ended December 31, 2006
increased by 13.4% from $638.5 million for the year ended December 31, 2005. The increase was
primarily due to increases in administrative and sales promotion expenses. The increase in
administrative expenses was primarily the result of an increase in consulting and legal fees of
$23.6 million, foreign currency transaction losses of $22.1 million associated with the Euro-denominated
debt and non-cash stock purchase and stock option compensation charges of $16.7 million. The
increase in sales promotion expenses was primarily the result of increased sales commissions, salaries
and incentive compensation.
Interest expense, net of interest income, of $900.7 million for the year ended December 31, 2006
increased by 80.1% from $500.0 million for the year ended December 31, 2005, primarily due to
increases in the weighted average interest rate and the weighted average debt outstanding. The
increase was partly offset by an increase in interest income.
The provision for taxes on income of $68.0 million for the year ended December 31, 2006 decreased by
62.0% from $179.1 million for the year ended December 31, 2005, primarily due to a decrease in income
before income taxes and minority interest for the year ended December 31, 2006 as compared to the
year ended December 31, 2005 and a $31.3 million provision relating to the repatriation of foreign
earnings for the year ended December 31, 2005. The decrease was partly offset by the establishment of
valuation allowances of $9.8 million relating to the realization of deferred tax assets in certain European
83