Hertz 2007 Annual Report Download - page 116
Download and view the complete annual report
Please find page 116 of the 2007 Hertz annual report below. You can navigate through the pages in the report by either clicking on the pages listed below, or by using the keyword search tool below to find specific information within the annual report.-
 1
1 -
2
-
3
-
4
-
5
-
6
-
7
-
8
-
9
-
10
-
11
-
12
-
13
-
14
-
15
-
16
-
17
-
18
-
19
-
20
-
21
-
22
-
23
-
24
-
25
-
26
-
27
-
28
-
29
-
30
-
31
-
32
-
33
-
34
-
35
-
36
-
37
-
38
-
39
-
40
-
41
-
42
-
43
-
44
-
45
-
46
-
47
-
48
-
49
-
50
-
51
-
52
-
53
-
54
-
55
-
56
-
57
-
58
-
59
-
60
-
61
-
62
-
63
-
64
-
65
-
66
-
67
-
68
-
69
-
70
-
71
-
72
-
73
-
74
-
75
-
76
-
77
-
78
-
79
-
80
-
81
-
82
-
83
-
84
-
85
-
86
-
87
-
88
-
89
-
90
-
91
-
92
-
93
-
94
-
95
-
96
-
97
-
98
-
99
-
100
-
101
-
102
-
103
-
104
-
105
-
 106
106 -
 107
107 -
 108
108 -
 109
109 -
 110
110 -
 111
111 -
 112
112 -
 113
113 -
 114
114 -
 115
115 -
 116
116 -
 117
117 -
 118
118 -
 119
119 -
 120
120 -
 121
121 -
 122
122 -
 123
123 -
 124
124 -
 125
125 -
 126
126 -
127
-
128
-
129
-
130
-
131
-
132
-
133
-
134
-
135
-
136
-
137
-
138
-
139
-
140
-
141
-
142
-
143
-
144
-
145
-
146
-
147
-
148
-
149
-
150
-
151
-
152
-
153
-
154
-
155
-
156
-
157
-
158
-
159
-
160
-
161
-
162
-
163
-
164
-
165
-
166
-
167
-
168
-
169
-
170
-
171
-
172
-
173
-
174
-
175
-
176
-
177
-
178
-
179
-
180
-
181
-
182
-
183
-
184
-
185
-
186
-
187
-
188
-
189
-
190
-
191
-
192
-
193
-
194
-
195
-
196
-
197
-
198
-
199
-
200
-
201
-
202
-
203
-
204
-
205
-
206
-
207
-
208
-
209
-
210
-
211
-
212
-
213
-
214
-
215
-
216
-
217
-
218
-
219
-
220
-
221
-
222
-
223
-
224
-
225
-
226
-
227
-
228
-
229
-
230
-
231
-
232
-
233
-
234
 |
 |

(5) Purchase obligations represent agreements to purchase goods or services that are legally binding on us and that specify all
significant terms, including fixed or minimum quantities; fixed, minimum or variable price provisions; and the approximate timing of
the transaction. Only the minimum non-cancelable portion of purchase agreements and related cancellation penalties are included
as obligations. In the case of contracts, which state minimum quantities of goods or services, amounts reflect only the stipulated
minimums; all other contracts reflect estimated amounts. Of the total purchase obligations as of December 31, 2007, $4,864.9 million
represent fleet purchases where contracts have been signed or are pending with committed orders under the terms of such
arrangements. We do not regard our employment relationships with our employees as ‘‘agreements to purchase services’’ for these
purposes.
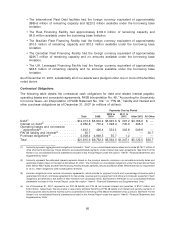
Capital Expenditures
The table below shows revenue earning equipment and property and equipment capital expenditures
and related disposal proceeds received by quarter for 2007, 2006 and 2005 (in millions of dollars):
Revenue Earning Equipment Property and Equipment
Net Capital
Capital Disposal Expenditures Capital Disposal Net Capital
Expenditures Proceeds (Proceeds) Expenditures Proceeds Expenditures
2007
Successor
First Quarter ............... $ 3,333.2 $ (2,243.2) $ 1,090.0 $ 37.6 $(10.8) $ 26.8
Second Quarter ............. 3,817.6 (2,061.9) 1,755.7 59.7 (16.6) 43.1
Third Quarter .............. 2,418.4 (2,268.9) 149.5 46.8 (25.8) 21.0
Fourth Quarter .............. 1,772.9 (2,640.3) (867.4) 51.9 (45.8) 6.1
Total Year ............... $11,342.1 $ (9,214.3) $ 2,127.8 $196.0 $(99.0) $ 97.0
2006
Successor
First Quarter ............... $ 3,862.1 $ (2,591.3) $ 1,270.8 $ 64.7 $(20.6) $ 44.1
Second Quarter ............. 3,678.2 (2,308.2) 1,370.0 65.9 (9.9) 56.0
Third Quarter .............. 1,814.5 (2,099.0) (284.5) 50.5 (23.2) 27.3
Fourth Quarter .............. 2,066.1 (2,556.5) (490.4) 42.8 (20.2) 22.6
Total Year ............... $11,420.9 $ (9,555.0) $ 1,865.9 $223.9 $(73.9) $150.0
2005
Predecessor
First Quarter ............... $ 3,600.2 $ (2,307.4) $ 1,292.8 $ 81.3 $ (9.5) $ 71.8
Second Quarter ............. 4,040.4 (2,304.3) 1,736.1 105.5 (22.9) 82.6
Third Quarter .............. 2,377.5 (2,579.5) (202.0) 92.9 (19.9) 73.0
Fourth Quarter (Oct. 1-Dec. 20,
2005) .................. 2,168.1 (2,915.1) (747.0) 54.8 (24.1) 30.7
Successor
Fourth Quarter (Dec. 21-Dec. 31,
2005) .................. 234.8 (199.7) 35.1 8.5 (1.5) 7.0
Total Year ............... $12,421.0 $(10,306.0) $ 2,115.0 $343.0 $(77.9) $265.1
Revenue earning equipment expenditures in our car rental operations were $10,631.9 million,
$10,545.7 million and $11,493.9 million for the years ended December 31, 2007, 2006 and 2005,
respectively. Revenue earning equipment expenditures in our equipment rental operations were
$710.2 million, $875.2 million and $927.1 million for the years ended December 31, 2007, 2006 and
2005, respectively.
Revenue earning equipment expenditures in our car rental and equipment rental operations for the year
ended December 31, 2007 increased by 0.8% and decreased by 18.9%, respectively, compared to the
year ended December 31, 2006. The increase in our car rental revenue earning equipment expenditures
is primarily due to higher rental volumes during the year ended December 31, 2007 as compared to the
year ended December 31, 2006, which required us to maintain higher fleet levels. The decrease in our
equipment rental operations revenue earning equipment expenditures is primarily due to reduced
spending on earth moving equipment as a result of slowing non-residential construction growth and our
efforts to age our equipment rental fleet during the year ended December 31, 2007 as compared to the
year ended December 31, 2006. Revenue earning equipment expenditures in our car rental and
96