Hertz 2007 Annual Report Download - page 92
Download and view the complete annual report
Please find page 92 of the 2007 Hertz annual report below. You can navigate through the pages in the report by either clicking on the pages listed below, or by using the keyword search tool below to find specific information within the annual report.-
 1
1 -
2
-
3
-
4
-
5
-
6
-
7
-
8
-
9
-
10
-
11
-
12
-
13
-
14
-
15
-
16
-
17
-
18
-
19
-
20
-
21
-
22
-
23
-
24
-
25
-
26
-
27
-
28
-
29
-
30
-
31
-
32
-
33
-
34
-
35
-
36
-
37
-
38
-
39
-
40
-
41
-
42
-
43
-
44
-
45
-
46
-
47
-
48
-
49
-
50
-
51
-
52
-
53
-
54
-
55
-
56
-
57
-
58
-
59
-
60
-
61
-
62
-
63
-
64
-
65
-
66
-
67
-
68
-
69
-
70
-
71
-
72
-
73
-
74
-
75
-
76
-
77
-
78
-
79
-
80
-
81
-
 82
82 -
 83
83 -
 84
84 -
 85
85 -
 86
86 -
 87
87 -
 88
88 -
 89
89 -
 90
90 -
 91
91 -
 92
92 -
 93
93 -
 94
94 -
 95
95 -
 96
96 -
 97
97 -
 98
98 -
 99
99 -
 100
100 -
 101
101 -
 102
102 -
103
-
104
-
105
-
106
-
107
-
108
-
109
-
110
-
111
-
112
-
113
-
114
-
115
-
116
-
117
-
118
-
119
-
120
-
121
-
122
-
123
-
124
-
125
-
126
-
127
-
128
-
129
-
130
-
131
-
132
-
133
-
134
-
135
-
136
-
137
-
138
-
139
-
140
-
141
-
142
-
143
-
144
-
145
-
146
-
147
-
148
-
149
-
150
-
151
-
152
-
153
-
154
-
155
-
156
-
157
-
158
-
159
-
160
-
161
-
162
-
163
-
164
-
165
-
166
-
167
-
168
-
169
-
170
-
171
-
172
-
173
-
174
-
175
-
176
-
177
-
178
-
179
-
180
-
181
-
182
-
183
-
184
-
185
-
186
-
187
-
188
-
189
-
190
-
191
-
192
-
193
-
194
-
195
-
196
-
197
-
198
-
199
-
200
-
201
-
202
-
203
-
204
-
205
-
206
-
207
-
208
-
209
-
210
-
211
-
212
-
213
-
214
-
215
-
216
-
217
-
218
-
219
-
220
-
221
-
222
-
223
-
224
-
225
-
226
-
227
-
228
-
229
-
230
-
231
-
232
-
233
-
234
 |
 |

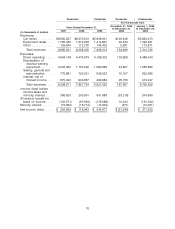
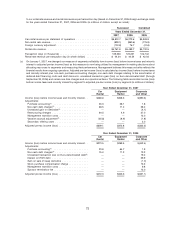
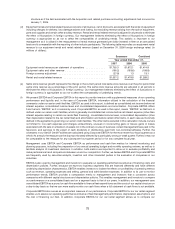
The following table sets forth certain of our selected car rental, equipment rental and other operating
data for each of the periods indicated:
Successor Combined
Years Ended, or as of December 31,
2007 2006 2005
Selected Car Rental Operating Data:
Worldwide number of transactions (in thousands) ....... 28,977 28,004 27,920
Domestic ................................... 21,547 20,940 21,081
International ................................. 7,430 7,064 6,839
Worldwide transaction days (in thousands)(a) ........... 129,353 123,251 122,102
Domestic ................................... 88,988 85,716 86,116
International ................................. 40,365 37,535 35,986
Worldwide rental rate revenue per transaction day(b) ...... $ 44.54 $ 44.54 $ 42.03
Domestic ................................... $ 43.77 $ 43.97 $ 42.43
International ................................. $ 46.25 $ 45.86 $ 41.10
Worldwide average number of company-operated cars
during the period ............................. 461,100 432,600 433,700
Domestic ................................... 313,300 294,900 299,900
International ................................. 147,800 137,700 133,800
Adjusted pre-tax income (in millions of dollars)(c) ........ $ 609.1 $ 472.3 $ 379.6
Worldwide revenue earning equipment, net (in millions of
dollars) .................................... $7,610.4 $ 7,366.4 $ 7,399.5
Selected Worldwide Equipment Rental Operating Data:
Rental and rental related revenue (in millions of dollars)(d) . . $ 1,537.2 $ 1,479.8 $ 1,269.2
Same store revenue growth(e) ...................... 1.7% 16.8% 21.6%
Average acquisition cost of rental equipment operated
during the period (in millions of dollars) ............. $3,305.3 $ 3,018.3 $ 2,588.0
Adjusted pre-tax income (in millions of dollars)(c) ........ $ 373.8 $ 345.5 $ 241.1
Revenue earning equipment, net (in millions of dollars) . . . $ 2,697.5 $ 2,439.1 $ 2,075.5
Other Operating Data:
Cash flows from operating activities (in million of dollars) . . $ 3,089.5 $ 2,604.8 $ 1,454.5
EBITDA (in millions of dollars)(f) ..................... 3,485.6 3,100.7 2,819.5
Corporate EBITDA (in millions of dollars)(f) ............. 1,541.5 1,378.7 1,141.3
(a) Transaction days represents the total number of days that vehicles were on rent in a given period.
(b) Car rental rate revenue consists of all revenue, net of discounts, associated with the rental of cars including charges for
optional insurance products, but excluding revenue derived from fueling and concession and other expense pass-throughs,
NeverLost units in the United States and certain ancillary revenue. Rental rate revenue per transaction day is calculated as
total rental rate revenue, divided by the total number of transaction days, with all periods adjusted to eliminate the effect of
fluctuations in foreign currency. Our management believes eliminating the effect of fluctuations in foreign currency is
appropriate so as not to affect the comparability of underlying trends. This statistic is important to management as it
represents the best measurement of the changes in underlying pricing in the car rental business and encompasses the
elements in car rental pricing that management has the ability to control. The following table reconciles our car rental revenue
72