Hertz 2007 Annual Report Download - page 93
Download and view the complete annual report
Please find page 93 of the 2007 Hertz annual report below. You can navigate through the pages in the report by either clicking on the pages listed below, or by using the keyword search tool below to find specific information within the annual report.-
 1
1 -
2
-
3
-
4
-
5
-
6
-
7
-
8
-
9
-
10
-
11
-
12
-
13
-
14
-
15
-
16
-
17
-
18
-
19
-
20
-
21
-
22
-
23
-
24
-
25
-
26
-
27
-
28
-
29
-
30
-
31
-
32
-
33
-
34
-
35
-
36
-
37
-
38
-
39
-
40
-
41
-
42
-
43
-
44
-
45
-
46
-
47
-
48
-
49
-
50
-
51
-
52
-
53
-
54
-
55
-
56
-
57
-
58
-
59
-
60
-
61
-
62
-
63
-
64
-
65
-
66
-
67
-
68
-
69
-
70
-
71
-
72
-
73
-
74
-
75
-
76
-
77
-
78
-
79
-
80
-
81
-
82
-
 83
83 -
 84
84 -
 85
85 -
 86
86 -
 87
87 -
 88
88 -
 89
89 -
 90
90 -
 91
91 -
 92
92 -
 93
93 -
 94
94 -
 95
95 -
 96
96 -
 97
97 -
 98
98 -
 99
99 -
 100
100 -
 101
101 -
 102
102 -
 103
103 -
104
-
105
-
106
-
107
-
108
-
109
-
110
-
111
-
112
-
113
-
114
-
115
-
116
-
117
-
118
-
119
-
120
-
121
-
122
-
123
-
124
-
125
-
126
-
127
-
128
-
129
-
130
-
131
-
132
-
133
-
134
-
135
-
136
-
137
-
138
-
139
-
140
-
141
-
142
-
143
-
144
-
145
-
146
-
147
-
148
-
149
-
150
-
151
-
152
-
153
-
154
-
155
-
156
-
157
-
158
-
159
-
160
-
161
-
162
-
163
-
164
-
165
-
166
-
167
-
168
-
169
-
170
-
171
-
172
-
173
-
174
-
175
-
176
-
177
-
178
-
179
-
180
-
181
-
182
-
183
-
184
-
185
-
186
-
187
-
188
-
189
-
190
-
191
-
192
-
193
-
194
-
195
-
196
-
197
-
198
-
199
-
200
-
201
-
202
-
203
-
204
-
205
-
206
-
207
-
208
-
209
-
210
-
211
-
212
-
213
-
214
-
215
-
216
-
217
-
218
-
219
-
220
-
221
-
222
-
223
-
224
-
225
-
226
-
227
-
228
-
229
-
230
-
231
-
232
-
233
-
234
 |
 |

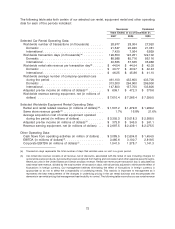
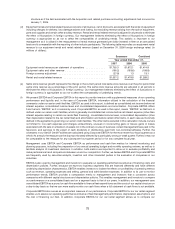
to our rental rate revenue and rental rate revenue per transaction day (based on December 31, 2006 foreign exchange rates)
for the years ended December 31, 2007, 2006 and 2005 (in millions of dollars, except as noted):
Successor Combined
Years Ended December 31,
2007 2006 2005
Car rental revenue per statement of operations ................... $6,800.7 $6,273.6 $5,949.9
Non-rental rate revenue .................................. (938.1) (860.6) (775.8)
Foreign currency adjustment ............................... (100.8) 76.7 (41.6)
Rental rate revenue ..................................... $5,761.8 $5,489.7 $5,132.5
Transaction days (in thousands) ............................. 129,353 123,251 122,102
Rental rate revenue per transaction day (in whole dollars) ............. $ 44.54 $ 44.54 $ 42.03
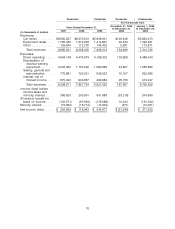
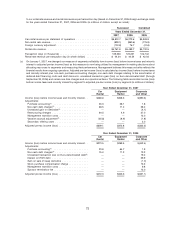
(c) On January 1, 2007, we changed our measure of segment profitability from income (loss) before income taxes and minority
interest to adjusted pre-tax income (loss) as this measure is now being utilized by management in making decisions about
allocating resources to segments and measuring their performance. Management believes this measure better reflects the
financial results from ongoing operations. Adjusted pre-tax income (loss) is calculated as income (loss) before income taxes
and minority interest plus non-cash purchase accounting charges, non-cash debt charges relating to the amortization of
deferred debt financing costs and debt discounts, unrealized transaction gain (loss) on Euro-denominated debt (through
September 30, 2006) and certain one-time charges and non-operational items. The following table reconciles income (loss)
before income taxes and minority interest by segment to adjusted pre-tax income (loss) by segment (in millions of dollars):
Year Ended December 31, 2007
Car Equipment Corporate
Rental Rental and Other
Income (loss) before income taxes and minority interest . . $468.6 $308.5 $(390.3)
Adjustments:
Purchase accounting(1) ..................... 35.3 58.1 1.8
Non-cash debt charges(2) .................... 66.5 11.2 28.2
Unrealized gain on derivative(3) ................ — — (4.1)
Restructuring charges ...................... 64.5 4.9 27.0
Management transition costs .................. — — 15.0
Vacation accrual adjustment(4) ................. (25.8) (8.9) (1.8)
Secondary offering costs .................... — — 2.0
Adjusted pre-tax income (loss) .................. $609.1 $373.8 $(322.2)
Year Ended December 31, 2006
Car Equipment Corporate
Rental Rental and Other
Income (loss) before income taxes and minority interest . . $373.5 $269.5 $(442.4)
Adjustments:
Purchase accounting(1) ..................... 23.8 64.7 1.9
Non-cash debt charges(2) .................... 75.0 11.3 13.2
Unrealized transaction loss on Euro-denominated debt(5) — — 19.2
Interest on HGH debt ...................... — — 39.9
Gain on sale of swap derivative ................ — — (1.0)
Stock purchase compensation charge ............ — — 13.3
Management transition costs .................. — — 9.8
Sponsor termination fee ..................... — — 15.0
Adjusted pre-tax income (loss) .................. $472.3 $345.5 $(331.1)
73