Hertz 2007 Annual Report Download - page 161
Download and view the complete annual report
Please find page 161 of the 2007 Hertz annual report below. You can navigate through the pages in the report by either clicking on the pages listed below, or by using the keyword search tool below to find specific information within the annual report.-
 1
1 -
2
-
3
-
4
-
5
-
6
-
7
-
8
-
9
-
10
-
11
-
12
-
13
-
14
-
15
-
16
-
17
-
18
-
19
-
20
-
21
-
22
-
23
-
24
-
25
-
26
-
27
-
28
-
29
-
30
-
31
-
32
-
33
-
34
-
35
-
36
-
37
-
38
-
39
-
40
-
41
-
42
-
43
-
44
-
45
-
46
-
47
-
48
-
49
-
50
-
51
-
52
-
53
-
54
-
55
-
56
-
57
-
58
-
59
-
60
-
61
-
62
-
63
-
64
-
65
-
66
-
67
-
68
-
69
-
70
-
71
-
72
-
73
-
74
-
75
-
76
-
77
-
78
-
79
-
80
-
81
-
82
-
83
-
84
-
85
-
86
-
87
-
88
-
89
-
90
-
91
-
92
-
93
-
94
-
95
-
96
-
97
-
98
-
99
-
100
-
101
-
102
-
103
-
104
-
105
-
106
-
107
-
108
-
109
-
110
-
111
-
112
-
113
-
114
-
115
-
116
-
117
-
118
-
119
-
120
-
121
-
122
-
123
-
124
-
125
-
126
-
127
-
128
-
129
-
130
-
131
-
132
-
133
-
134
-
135
-
136
-
137
-
138
-
139
-
140
-
141
-
142
-
143
-
144
-
145
-
146
-
147
-
148
-
149
-
150
-
 151
151 -
 152
152 -
 153
153 -
 154
154 -
 155
155 -
 156
156 -
 157
157 -
 158
158 -
 159
159 -
 160
160 -
 161
161 -
 162
162 -
 163
163 -
 164
164 -
 165
165 -
 166
166 -
 167
167 -
 168
168 -
 169
169 -
 170
170 -
 171
171 -
172
-
173
-
174
-
175
-
176
-
177
-
178
-
179
-
180
-
181
-
182
-
183
-
184
-
185
-
186
-
187
-
188
-
189
-
190
-
191
-
192
-
193
-
194
-
195
-
196
-
197
-
198
-
199
-
200
-
201
-
202
-
203
-
204
-
205
-
206
-
207
-
208
-
209
-
210
-
211
-
212
-
213
-
214
-
215
-
216
-
217
-
218
-
219
-
220
-
221
-
222
-
223
-
224
-
225
-
226
-
227
-
228
-
229
-
230
-
231
-
232
-
233
-
234
 |
 |

HERTZ GLOBAL HOLDINGS, INC. AND SUBSIDIARIES
NOTES TO CONSOLIDATED FINANCIAL STATEMENTS (Continued)
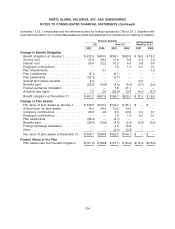
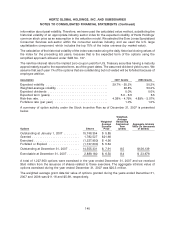
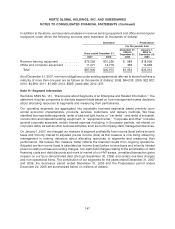
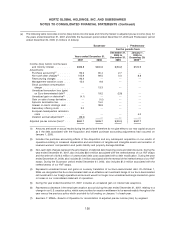
A summary of non-vested options as of December 31, 2007, and changes during the year, is presented
below.
Weighted- Weighted-
Average Average Grant-
Exercise Date Calculated
Non-vested Shares Price Value
Non-vested as of January 1, 2007 ........... 15,748,354 $ 5.85 $ 5.99
Granted .............................. 1,782,527 $21.66 $11.16
Vested ............................... (4,117,130) $ 5.90 $ 6.02
Forfeited or Expired ..................... (1,747,600) $ 5.64 $ 5.57
Non-vested as of December 31, 2007 ......... 11,666,151 $ 8.21 $ 6.90
For the year ended December 31, 2007, we recognized compensation cost of $32.9 million
($20.2 million, net of tax) including $5.1 million related to restructuring activities to accelerate the vesting
for certain executives. As of December 31, 2007, there was approximately $85.3 million of total
unrecognized compensation cost related to non-vested stock options granted by Hertz Holdings under
the Stock Incentive Plan, including costs related to modifying the exercise prices of certain option grants
in order to preserve the intrinsic value of the options, consistent with applicable tax law, to reflect special
cash dividends of $4.32 per share paid on June 30, 2006 and $1.12 per share paid on November 21,
2006. These remaining costs are expected to be recognized over the remaining 2.1 years, on a weighted
average basis, of the requisite service period that began on the grant dates. For the year ended
December 31, 2006, we recognized compensation cost of $13.8 million ($8.3 million, net of tax).
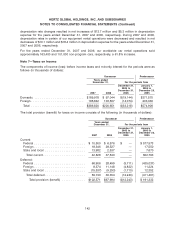
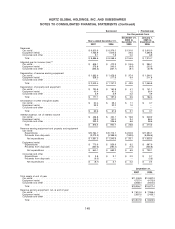
Note 6—Depreciation of Revenue Earning Equipment
Depreciation of revenue earning equipment includes the following (in thousands of dollars):
Successor Predecessor
Years ended December 31, For the periods from
December 21, January 1,
2005 to 2005 to
December 31, December 20,
2007 2006 2005 2005
Depreciation of revenue earning equipment . $1,905,846 $1,761,804 $45,362 $1,605,243
Adjustment of depreciation upon disposal of
the equipment ..................... 21,185 (35,857) (2,123) (68,307)
Rents paid for vehicles leased ........... 76,329 31,255 588 18,926
Total ............................ $2,003,360 $1,757,202 $43,827 $1,555,862
The adjustment of depreciation upon disposal of revenue earning equipment for the years ended
December 31, 2007 and 2006, the Successor period ended December 31, 2005 and the Predecessor
period ended December 20, 2005 included (in millions of dollars) net gains of $0.6, $16.3, $1.3 and
$41.8, respectively, on the disposal of industrial and construction equipment used in our equipment
rental operations, and a net loss of $21.8 and net gains of $19.6, $0.8 and $26.5, respectively, on the
disposal of vehicles used in our car rental operations.
Depreciation rates are reviewed on an ongoing basis based on management’s routine review of present
and estimated future market conditions and their effect on residual values at the time of disposal. During
2007 and 2006, depreciation rates being used to compute the provision for depreciation of revenue
earning equipment were adjusted on certain vehicles in our car rental operations to reflect changes in
the estimated residual values to be realized when revenue earning equipment is sold. These
141