Hertz 2007 Annual Report Download - page 167
Download and view the complete annual report
Please find page 167 of the 2007 Hertz annual report below. You can navigate through the pages in the report by either clicking on the pages listed below, or by using the keyword search tool below to find specific information within the annual report.-
 1
1 -
2
-
3
-
4
-
5
-
6
-
7
-
8
-
9
-
10
-
11
-
12
-
13
-
14
-
15
-
16
-
17
-
18
-
19
-
20
-
21
-
22
-
23
-
24
-
25
-
26
-
27
-
28
-
29
-
30
-
31
-
32
-
33
-
34
-
35
-
36
-
37
-
38
-
39
-
40
-
41
-
42
-
43
-
44
-
45
-
46
-
47
-
48
-
49
-
50
-
51
-
52
-
53
-
54
-
55
-
56
-
57
-
58
-
59
-
60
-
61
-
62
-
63
-
64
-
65
-
66
-
67
-
68
-
69
-
70
-
71
-
72
-
73
-
74
-
75
-
76
-
77
-
78
-
79
-
80
-
81
-
82
-
83
-
84
-
85
-
86
-
87
-
88
-
89
-
90
-
91
-
92
-
93
-
94
-
95
-
96
-
97
-
98
-
99
-
100
-
101
-
102
-
103
-
104
-
105
-
106
-
107
-
108
-
109
-
110
-
111
-
112
-
113
-
114
-
115
-
116
-
117
-
118
-
119
-
120
-
121
-
122
-
123
-
124
-
125
-
126
-
127
-
128
-
129
-
130
-
131
-
132
-
133
-
134
-
135
-
136
-
137
-
138
-
139
-
140
-
141
-
142
-
143
-
144
-
145
-
146
-
147
-
148
-
149
-
150
-
151
-
152
-
153
-
154
-
155
-
156
-
 157
157 -
 158
158 -
 159
159 -
 160
160 -
 161
161 -
 162
162 -
 163
163 -
 164
164 -
 165
165 -
 166
166 -
 167
167 -
 168
168 -
 169
169 -
 170
170 -
 171
171 -
 172
172 -
 173
173 -
 174
174 -
 175
175 -
 176
176 -
 177
177 -
178
-
179
-
180
-
181
-
182
-
183
-
184
-
185
-
186
-
187
-
188
-
189
-
190
-
191
-
192
-
193
-
194
-
195
-
196
-
197
-
198
-
199
-
200
-
201
-
202
-
203
-
204
-
205
-
206
-
207
-
208
-
209
-
210
-
211
-
212
-
213
-
214
-
215
-
216
-
217
-
218
-
219
-
220
-
221
-
222
-
223
-
224
-
225
-
226
-
227
-
228
-
229
-
230
-
231
-
232
-
233
-
234
 |
 |

HERTZ GLOBAL HOLDINGS, INC. AND SUBSIDIARIES
NOTES TO CONSOLIDATED FINANCIAL STATEMENTS (Continued)
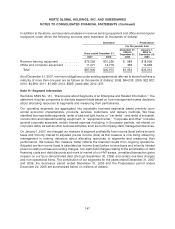
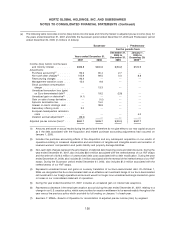
In addition to the above, we have various leases on revenue earning equipment and office and computer
equipment under which the following amounts were expensed (in thousands of dollars):
Successor Predecessor
For the periods from
December 21, January 1,
2005 to 2005 to
Years ended December 31, December 31, December 20,
2007 2006 2005 2005
Revenue earning equipment ........... $76,329 $31,255 $ 588 $18,926
Office and computer equipment ........ 11,271 14,718 466 14,984
Total ........................... $87,600 $45,973 $1,054 $33,910
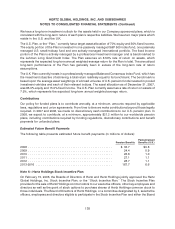
As of December 31, 2007, minimum obligations under existing agreements referred to above that have a
maturity of more than one year are as follows (in thousands of dollars): 2008, $64,033; 2009, $22,902;
2010, $4,990; 2011, $1,069; 2012, $585; years after 2012, $37.
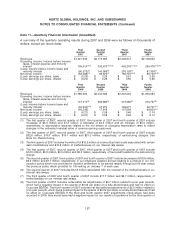
Note 9—Segment Information
We follow SFAS No. 131, ‘‘Disclosures about Segments of an Enterprise and Related Information.’’ The
statement requires companies to disclose segment data based on how management makes decisions
about allocating resources to segments and measuring their performance.
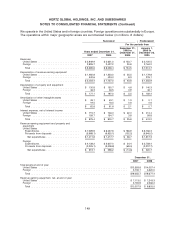
Our operating segments are aggregated into reportable business segments based primarily upon
similar economic characteristics, products, services, customers, and delivery methods. We have
identified two reportable segments: rental of cars and light trucks, or ‘‘car rental’’; and rental of industrial,
construction and material handling equipment, or ‘‘equipment rental.’’ ‘‘Corporate and other’’ includes
general corporate expenses, certain interest expense (including, in Successor periods, net interest on
corporate debt), as well as other business activities, such as our third party claim management services.
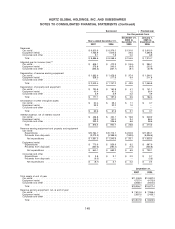
On January 1, 2007, we changed our measure of segment profitability from income (loss) before income
taxes and minority interest to adjusted pre-tax income (loss) as this measure is now being utilized by
management in making decisions about allocating resources to segments and measuring their
performance. We believe this measure better reflects the financial results from ongoing operations.
Adjusted pre-tax income (loss) is calculated as income (loss) before income taxes and minority interest
plus non-cash purchase accounting charges, non-cash debt charges relating to the amortization of debt
financing costs and debt discounts and mark to market of our HVF swaps, unrealized transaction gains
(losses) on our Euro-denominated debt (through September 30, 2006) and certain one-time charges
and non-operational items. The contribution of our segments for the years ended December 31, 2007
and 2006, the Successor period ended December 31, 2005 and the Predecessor period ended
December 20, 2005 are summarized below (in millions of dollars).
147