GameStop 2012 Annual Report Download - page 95
Download and view the complete annual report
Please find page 95 of the 2012 GameStop annual report below. You can navigate through the pages in the report by either clicking on the pages listed below, or by using the keyword search tool below to find specific information within the annual report.-
 1
1 -
2
-
3
-
4
-
5
-
6
-
7
-
8
-
9
-
10
-
11
-
12
-
13
-
14
-
15
-
16
-
17
-
18
-
19
-
20
-
21
-
22
-
23
-
24
-
25
-
26
-
27
-
28
-
29
-
30
-
31
-
32
-
33
-
34
-
35
-
36
-
37
-
38
-
39
-
40
-
41
-
42
-
43
-
44
-
45
-
46
-
47
-
48
-
49
-
50
-
51
-
52
-
53
-
54
-
55
-
56
-
57
-
58
-
59
-
60
-
61
-
62
-
63
-
64
-
65
-
66
-
67
-
68
-
69
-
70
-
71
-
72
-
73
-
74
-
75
-
76
-
77
-
78
-
79
-
80
-
81
-
82
-
83
-
84
-
 85
85 -
 86
86 -
 87
87 -
 88
88 -
 89
89 -
 90
90 -
 91
91 -
 92
92 -
 93
93 -
 94
94 -
 95
95 -
 96
96 -
 97
97 -
 98
98 -
 99
99 -
 100
100 -
 101
101 -
 102
102 -
 103
103 -
 104
104 -
 105
105 -
106
-
107
-
108
-
109
-
110
-
111
-
112
-
113
-
114
-
115
-
116
-
117
-
118
-
119
-
120
-
121
-
122
-
123
 |
 |

GAMESTOP CORP.
NOTES TO CONSOLIDATED FINANCIAL STATEMENTS — (Continued)
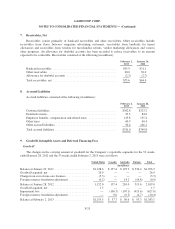
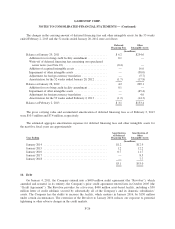
5. Computation of Net Income (Loss) per Common Share
The Company has Class A Common Stock outstanding. A reconciliation of shares used in calculating basic
and diluted net income (loss) per common share is as follows:
53 Weeks
Ended
February 2,
2013
52 Weeks
Ended
January 28,
2012
52 Weeks
Ended
January 29,
2011
(In millions, except per share data)
Net income (loss) attributable to GameStop Corp. ........ $(269.7) $339.9 $408.0
Weighted average common shares outstanding ........... 126.4 139.9 151.6
Dilutive effect of options and restricted shares on common
stock .......................................... — 1.1 2.4
Common shares and dilutive potential common shares ..... 126.4 141.0 154.0
Net income (loss) per common share:
Basic ............................................ $ (2.13) $ 2.43 $ 2.69
Diluted .......................................... $ (2.13) $ 2.41 $ 2.65
The weighted average outstanding shares of Class A Common Stock for basic and diluted net loss per
common share were the same due to the net loss in the year ended February 2, 2013.
The following table contains information on restricted shares and options to purchase shares of Class A
Common Stock which were excluded from the computation of diluted earnings per share because they were anti-
dilutive:
Anti-
Dilutive
Shares
Range of
Exercise
Prices
Expiration
Dates
(In millions, except per share data)
53 Weeks Ended February 2, 2013 ................... 3.3 $ 9.29 - 49.95 2013 - 2020
52 Weeks Ended January 28, 2012 ................... 2.5 $26.02 - 49.95 2017 - 2019
52 Weeks Ended January 29, 2011 ................... 4.0 $20.32 - 49.95 2017 - 2020
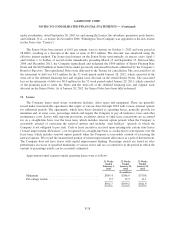
6. Fair Value Measurements and Financial Instruments
Recurring Fair Value Measurements and Derivative Financial Instruments
The Company defines fair value as the price that would be received from selling an asset or paid to transfer
a liability in an orderly transaction between market participants at the measurement date. Fair value accounting
guidance applies to our Foreign Currency Contracts, Company-owned life insurance policies with a cash
surrender value and certain nonqualified deferred compensation liabilities that are measured at fair value on a
recurring basis in periods subsequent to initial recognition.
Fair value accounting guidance requires disclosures that categorize assets and liabilities measured at fair
value into one of three different levels depending on the observability of the inputs employed in the
measurement. Level 1 inputs are quoted prices in active markets for identical assets or liabilities. Level 2 inputs
are observable inputs other than quoted prices included within Level 1 for the asset or liability, either directly or
indirectly through market-corroborated inputs. Level 3 inputs are unobservable inputs for the asset or liability
reflecting our assumptions about pricing by market participants.
F-20