GameStop 2012 Annual Report Download - page 2
Download and view the complete annual report
Please find page 2 of the 2012 GameStop annual report below. You can navigate through the pages in the report by either clicking on the pages listed below, or by using the keyword search tool below to find specific information within the annual report.-
 1
1 -
 2
2 -
 3
3 -
 4
4 -
 5
5 -
 6
6 -
 7
7 -
 8
8 -
 9
9 -
 10
10 -
 11
11 -
 12
12 -
 13
13 -
14
-
15
-
16
-
17
-
18
-
19
-
20
-
21
-
22
-
23
-
24
-
25
-
26
-
27
-
28
-
29
-
30
-
31
-
32
-
33
-
34
-
35
-
36
-
37
-
38
-
39
-
40
-
41
-
42
-
43
-
44
-
45
-
46
-
47
-
48
-
49
-
50
-
51
-
52
-
53
-
54
-
55
-
56
-
57
-
58
-
59
-
60
-
61
-
62
-
63
-
64
-
65
-
66
-
67
-
68
-
69
-
70
-
71
-
72
-
73
-
74
-
75
-
76
-
77
-
78
-
79
-
80
-
81
-
82
-
83
-
84
-
85
-
86
-
87
-
88
-
89
-
90
-
91
-
92
-
93
-
94
-
95
-
96
-
97
-
98
-
99
-
100
-
101
-
102
-
103
-
104
-
105
-
106
-
107
-
108
-
109
-
110
-
111
-
112
-
113
-
114
-
115
-
116
-
117
-
118
-
119
-
120
-
121
-
122
-
123
 |
 |
level up (verb)
1. (gaming, video games) To progress to the next level of the game, of player
character stats and abilities.
a. Oen by acquiring experience points in role-playing games.
2. (retail, corporate) To advance the organization by capitalizing on the
launch of innovative, new game consoles and expanding its emerging mobile
and digital businesses.
a. Achieved through hard work, great associates, and disciplined resolve.
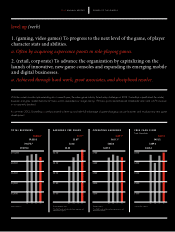
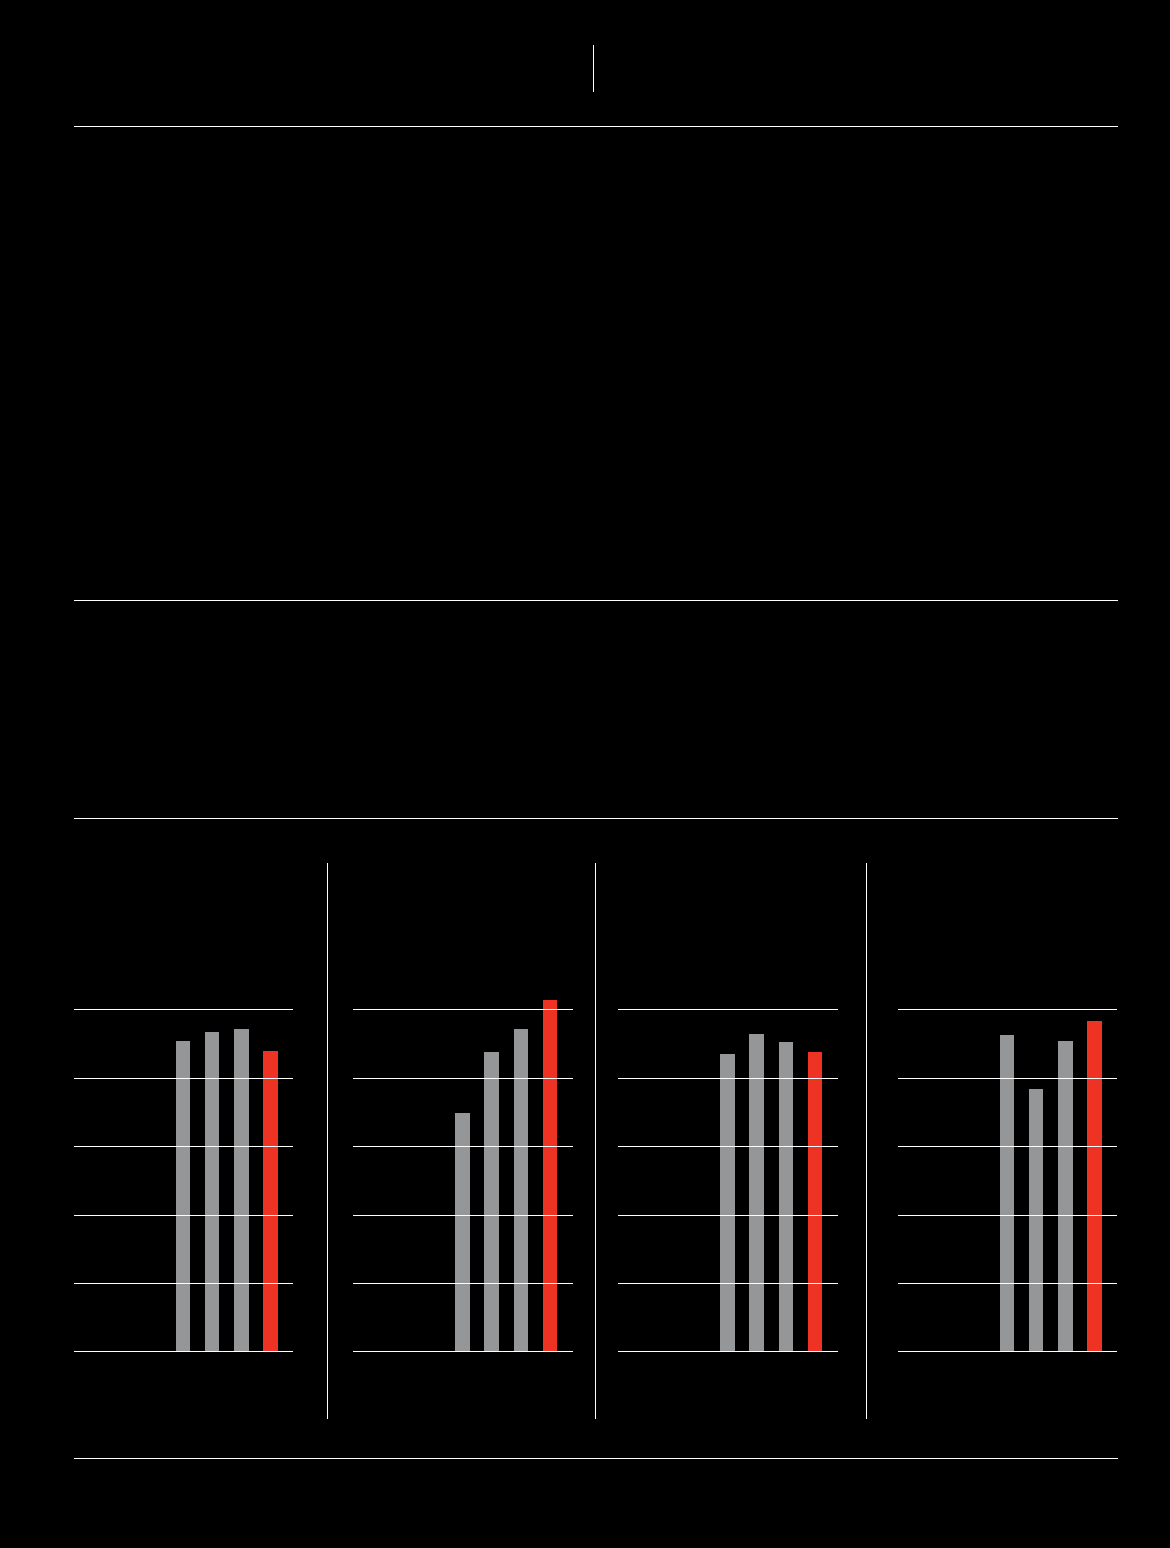
TOTAL REVENUES EARNINGS PER SHARE OPERATING EARNINGS FREE CASH FLOW
from Operations
$2,000 $1.00 $300 $100
$4,000 $1.50 $400 $200
$6,000 $2.00 $500 $300
$8,000 $2.50 $600 $400
$10,000 $3.00 $700 $500
$9,550.5 $2.87* $651.1* $453.2
$8,886.7 $3.17* $639.1* $481.2
$9,473.7 $2.65 $662.6 $389.2
$9,078.0 $2.25 $637.0 $465.4
09 09 09 0910 10 10 1011 11 11 1112 12 12 12
Revenue in millions Diluted earnings per share
*Non-GAAP results; excludes restructuring, impairment and
debt-retirement expenses
Earnings in millions
*Non-GAAP results; excludes restructuring, impairment and
debt-retirement expenses
Free cash flow in millions
2012 ANNUAL REPORT POWER TO THE PLAYERS
With the current console cycle extending into its seventh year, the video game industry faced many challenges in 2012. GameStop outperformed the market,
however, and grew market share by 221 basis points, expanded our margin rate by 170 basis points and enhanced shareholder return with a 67% increase
in our quarterly dividend.
As we enter 2013, GameStop is well-positioned to level up and take full advantage of game-changing console launches and revolutionary new game
development.