GameStop 2012 Annual Report Download - page 3
Download and view the complete annual report
Please find page 3 of the 2012 GameStop annual report below. You can navigate through the pages in the report by either clicking on the pages listed below, or by using the keyword search tool below to find specific information within the annual report.-
 1
1 -
 2
2 -
 3
3 -
 4
4 -
 5
5 -
 6
6 -
 7
7 -
 8
8 -
 9
9 -
 10
10 -
 11
11 -
 12
12 -
 13
13 -
 14
14 -
15
-
16
-
17
-
18
-
19
-
20
-
21
-
22
-
23
-
24
-
25
-
26
-
27
-
28
-
29
-
30
-
31
-
32
-
33
-
34
-
35
-
36
-
37
-
38
-
39
-
40
-
41
-
42
-
43
-
44
-
45
-
46
-
47
-
48
-
49
-
50
-
51
-
52
-
53
-
54
-
55
-
56
-
57
-
58
-
59
-
60
-
61
-
62
-
63
-
64
-
65
-
66
-
67
-
68
-
69
-
70
-
71
-
72
-
73
-
74
-
75
-
76
-
77
-
78
-
79
-
80
-
81
-
82
-
83
-
84
-
85
-
86
-
87
-
88
-
89
-
90
-
91
-
92
-
93
-
94
-
95
-
96
-
97
-
98
-
99
-
100
-
101
-
102
-
103
-
104
-
105
-
106
-
107
-
108
-
109
-
110
-
111
-
112
-
113
-
114
-
115
-
116
-
117
-
118
-
119
-
120
-
121
-
122
-
123
 |
 |

2012 ANNUAL REPORT POWER TO THE PLAYERS
TO OUR SHAREHOLDERS
Seven years into the current console cycle, we knew 2012 would be tough for the video game industry, so we entered the year with disciplined
resolve to control expenses and persist in executing our strategic plan. As a result, we significantly outperformed the market and again
expanded our gross margin rates despite a decrease in topline sales.
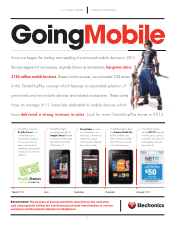
As expected, digital receipts grew nearly 40% in 2012, driven by our ability to leverage our store base to bring digital content and currency to our
customers. We expect strong growth in this category and are excited about the opportunity a new console cycle presents for us.
We continue to utilize consumer insights gathered through our PowerUp RewardsTM loyalty program to find new revenue streams and adapt to the
changing marketplace. Our mobile and recommerce business is a compelling example of how we are identifying and integrating
complementary categories into our unique buy-sell-trade model. Though only in its second year, this segment greatly contributed to our margin
expansion and has added a considerable amount of currency to our buy-sell-trade ecosystem.
We’re also optimistic about our international business, which performed well in 2012. We continued to refine our business model in every country
by implementing best practices from our United States operations and introducing new product categories to our stores around the world.
Along with driving new business initiatives, we continued to demonstrate capital discipline by returning more than 100% of free cash flow to our
shareholders through the combination of stock buybacks and dividends. In fact, we increased our dividend payout by 67% in 2012. Our board
and management team are focused on increasing shareholder return.
In a cyclical business like this, it is essential to drive a high rate of internal change to remain agile. Our entrepreneurial culture continues to propel
the organization forward to meet the changing needs of our customers. As we prepare to level up to the next console cycle, we are in a stronger
market share position than ever before, with the right strategies and tactics to drive continued growth.
On behalf of our board, executive leadership team and 40,000 team members worldwide, we thank you for your continued support of GameStop.
Daniel A. DeMatteo
Executive Chairman
J. Paul Raines
Chief Executive Officer
D
i
l
A
D
M
1
th
the
right
strategies
t
and
tactics
t
o
drive
continued
growth
.
t
ea
m
a
nd 40,000
t
ea
m
m
em
be
rs
worldwide,
we
t
ha
nk
e
you
k
f
or
your
r
c
on
ti
nu
ed
r
sup
p
1
Executive
Chairman
e
J
P
l
R
i