GameStop 2012 Annual Report Download - page 52
Download and view the complete annual report
Please find page 52 of the 2012 GameStop annual report below. You can navigate through the pages in the report by either clicking on the pages listed below, or by using the keyword search tool below to find specific information within the annual report.-
 1
1 -
2
-
3
-
4
-
5
-
6
-
7
-
8
-
9
-
10
-
11
-
12
-
13
-
14
-
15
-
16
-
17
-
18
-
19
-
20
-
21
-
22
-
23
-
24
-
25
-
26
-
27
-
28
-
29
-
30
-
31
-
32
-
33
-
34
-
35
-
36
-
37
-
38
-
39
-
40
-
41
-
 42
42 -
 43
43 -
 44
44 -
 45
45 -
 46
46 -
 47
47 -
 48
48 -
 49
49 -
 50
50 -
 51
51 -
 52
52 -
 53
53 -
 54
54 -
 55
55 -
 56
56 -
 57
57 -
 58
58 -
 59
59 -
 60
60 -
 61
61 -
 62
62 -
63
-
64
-
65
-
66
-
67
-
68
-
69
-
70
-
71
-
72
-
73
-
74
-
75
-
76
-
77
-
78
-
79
-
80
-
81
-
82
-
83
-
84
-
85
-
86
-
87
-
88
-
89
-
90
-
91
-
92
-
93
-
94
-
95
-
96
-
97
-
98
-
99
-
100
-
101
-
102
-
103
-
104
-
105
-
106
-
107
-
108
-
109
-
110
-
111
-
112
-
113
-
114
-
115
-
116
-
117
-
118
-
119
-
120
-
121
-
122
-
123
 |
 |

The Company includes purchasing, receiving and distribution costs in selling, general and administrative
expenses, rather than in cost of sales, in the statement of operations. The Company includes processing fees
associated with purchases made by check and credit cards in cost of sales, rather than selling, general and
administrative expenses, in the statement of operations. As a result of these classifications, our gross margins are
not comparable to those retailers that include purchasing, receiving and distribution costs in cost of sales and
include processing fees associated with purchases made by check and credit cards in selling, general and
administrative expenses. The net effect of these classifications as a percentage of sales has not historically been
material.
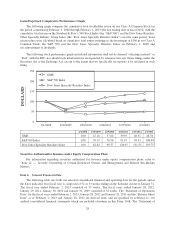
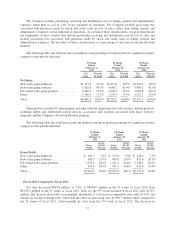
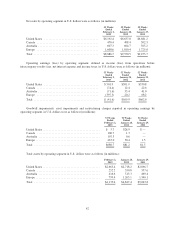
The following table sets forth net sales (in millions) and percentage of total net sales by significant product
category for the periods indicated:
53 Weeks
Ended
February 2,
2013
52 Weeks
Ended
January 28,
2012
52 Weeks
Ended
January 29,
2011
Net
Sales
Percent
of Total
Net
Sales
Percent
of Total
Net
Sales
Percent
of Total
Net Sales:
New video game hardware ................. $1,333.4 15.0% $1,611.6 16.9% $1,720.0 18.1%
New video game software ................. 3,582.4 40.3% 4,048.2 42.4% 3,968.7 41.9%
Pre-owned video game products ............. 2,430.5 27.4% 2,620.2 27.4% 2,469.8 26.1%
Other .................................. 1,540.4 17.3% 1,270.5 13.3% 1,315.2 13.9%
Total .................................. $8,886.7 100.0% $9,550.5 100.0% $9,473.7 100.0%
Other products include PC entertainment and other software, digital products and currency, mobile products,
including tablets and refurbished mobile devices, accessories and revenues associated with Game Informer
magazine and the Company’s PowerUp Rewards program.
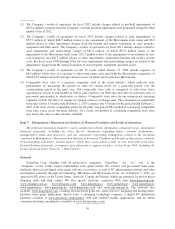
The following table sets forth gross profit (in millions) and gross profit percentages by significant product
category for the periods indicated:
53 Weeks
Ended
February 2,
2013
52 Weeks
Ended
January 28,
2012
52 Weeks
Ended
January 29,
2011
Gross
Profit
Gross
Profit
Percent
Gross
Profit
Gross
Profit
Percent
Gross
Profit
Gross
Profit
Percent
Gross Profit:
New video game hardware ................... $ 101.7 7.6% $ 113.6 7.0% $ 124.9 7.3%
New video game software .................... 786.3 21.9% 839.0 20.7% 819.6 20.7%
Pre-owned video game products ............... 1,170.1 48.1% 1,221.2 46.6% 1,140.5 46.2%
Other .................................... 593.4 38.5% 505.7 39.8% 452.6 34.4%
Total ..................................... $2,651.5 29.8% $2,679.5 28.1% $2,537.6 26.8%
Fiscal 2012 Compared to Fiscal 2011
Net sales decreased $663.8 million, or 7.0%, to $8,886.7 million in the 53 weeks of fiscal 2012 from
$9,550.5 million in the 52 weeks of fiscal 2011. Sales for the 53rd week included in fiscal 2012 were $112.2
million. The decrease in net sales was primarily attributable to a decrease in comparable store sales of 8.0% and
changes in foreign exchange rates, which had the effect of decreasing sales by $90.7 million when compared to
the 52 weeks of fiscal 2011, offset partially by sales from the 53rd week in fiscal 2012. The decrease in
37