GameStop 2012 Annual Report Download - page 59
Download and view the complete annual report
Please find page 59 of the 2012 GameStop annual report below. You can navigate through the pages in the report by either clicking on the pages listed below, or by using the keyword search tool below to find specific information within the annual report.-
 1
1 -
2
-
3
-
4
-
5
-
6
-
7
-
8
-
9
-
10
-
11
-
12
-
13
-
14
-
15
-
16
-
17
-
18
-
19
-
20
-
21
-
22
-
23
-
24
-
25
-
26
-
27
-
28
-
29
-
30
-
31
-
32
-
33
-
34
-
35
-
36
-
37
-
38
-
39
-
40
-
41
-
42
-
43
-
44
-
45
-
46
-
47
-
48
-
 49
49 -
 50
50 -
 51
51 -
 52
52 -
 53
53 -
 54
54 -
 55
55 -
 56
56 -
 57
57 -
 58
58 -
 59
59 -
 60
60 -
 61
61 -
 62
62 -
 63
63 -
 64
64 -
 65
65 -
 66
66 -
 67
67 -
 68
68 -
 69
69 -
70
-
71
-
72
-
73
-
74
-
75
-
76
-
77
-
78
-
79
-
80
-
81
-
82
-
83
-
84
-
85
-
86
-
87
-
88
-
89
-
90
-
91
-
92
-
93
-
94
-
95
-
96
-
97
-
98
-
99
-
100
-
101
-
102
-
103
-
104
-
105
-
106
-
107
-
108
-
109
-
110
-
111
-
112
-
113
-
114
-
115
-
116
-
117
-
118
-
119
-
120
-
121
-
122
-
123
 |
 |
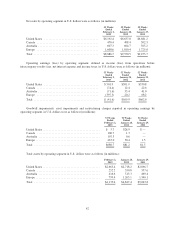
Excluding the impact of the goodwill and asset impairment charges, adjusted segment operating earnings were
$26.3 million in fiscal 2012, compared to $13.7 million in fiscal 2011. The increase in adjusted segment
operating earnings was due to an increase in gross profit dollars as a result of the shift in sales mix from
hardware to higher margin categories and an increase in gross profit percent in pre-owned video game products.
The increase in adjusted segment operating earnings was also due to a decrease in selling, general and
administrative expenses as a result of lower sales and lower store count when compared to fiscal 2011.
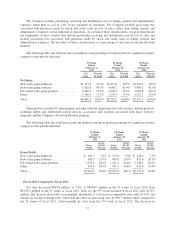
Australia
Segment results for Australia include retail operations and e-commerce sites in Australia and New Zealand.
As of February 2, 2013, the Australian segment included 416 stores, compared to 411 stores as of January 28,
2012. Net sales for the 53 weeks ended February 2, 2013 increased 0.4% compared to the 52 weeks ended
January 28, 2012. The increase in net sales was primarily due to the additional sales in the 53rd week of fiscal
2012 and the impact of five new stores opened since January 29, 2012, offset by a decrease in sales at existing
stores of 2.4%. The decrease in sales at existing stores was due to a decrease in new video game hardware sales,
new video game software sales and pre-owned video game products sales, offset by an increase in other product
sales. The decrease in new video game hardware sales is primarily due to a decrease in hardware unit sell-
through related to being in the late stages of the current console cycle. The decrease in new video game software
sales is primarily due to lower sales of new release video game titles and the late stages of the current console
cycle. The decrease in pre-owned video game products sales is due primarily to a decrease in store traffic related
to lower sales of new release video game titles and the late stages of the current console cycle. The increase in
other product sales was primarily due to an increase in PC entertainment software sales and sales of mobile
devices.
The segment operating loss for fiscal 2012 was $71.6 million compared to operating earnings of
$35.4 million for fiscal 2011. The decrease in operating earnings was primarily due to the goodwill and asset
impairment charges of $107.3 million recognized during fiscal 2012 compared to $0.6 million in fiscal 2011.
Excluding the impact of the goodwill and asset impairment charges, adjusted segment operating earnings
remained relatively flat at $35.7 million in fiscal 2012, when compared to $36.0 million in fiscal 2011.
Europe
Segment results for Europe include retail operations in 11 European countries and e-commerce operations in
six countries. As of February 2, 2013, the European segment operated 1,425 stores, compared to 1,423 stores as
of January 28, 2012. For the 53 weeks ended February 2, 2013, European net sales decreased 11.1% compared to
the 52 weeks ended January 28, 2012. This decrease in net sales was partially due to the unfavorable impact of
changes in exchange rates in fiscal 2012, which had the effect of decreasing sales by $95.7 million when
compared to fiscal 2011. Excluding the impact of changes in exchange rates, sales in the European segment
decreased 5.9%. The decrease in sales was primarily due to a decrease in sales at existing stores of 8.3%, offset
by additional sales in the 53rd week of fiscal 2012 when compared to fiscal 2011. The decrease in net sales at
existing stores was primarily due to decreases in new video game hardware sales, new video game software sales
and pre-owned video game products sales, offset partially by an increase in other product sales. The decrease in
new video game hardware sales is primarily due to a decrease in hardware unit sell-through related to being in
the late stages of the current console cycle. The decrease in new video game software sales is primarily due to
lower sales of new release video game titles and the late stages of the current console cycle. The decrease in pre-
owned video game products sales is due primarily to a decrease in store traffic related to lower sales of new
release video game titles and the late stages of the current console cycle. The increase in other product sales is
due to an increase in sales of PC entertainment software sales and sales of mobile devices.
The segment operating loss was $397.5 million for fiscal 2012 compared to operating earnings of $20.2
million for fiscal 2011. The decrease in operating earnings was primarily due to the goodwill and asset
impairments and restructuring charges of $467.0 million recognized during fiscal 2012 compared to $50.4
44