GameStop 2012 Annual Report Download - page 60
Download and view the complete annual report
Please find page 60 of the 2012 GameStop annual report below. You can navigate through the pages in the report by either clicking on the pages listed below, or by using the keyword search tool below to find specific information within the annual report.-
 1
1 -
2
-
3
-
4
-
5
-
6
-
7
-
8
-
9
-
10
-
11
-
12
-
13
-
14
-
15
-
16
-
17
-
18
-
19
-
20
-
21
-
22
-
23
-
24
-
25
-
26
-
27
-
28
-
29
-
30
-
31
-
32
-
33
-
34
-
35
-
36
-
37
-
38
-
39
-
40
-
41
-
42
-
43
-
44
-
45
-
46
-
47
-
48
-
49
-
 50
50 -
 51
51 -
 52
52 -
 53
53 -
 54
54 -
 55
55 -
 56
56 -
 57
57 -
 58
58 -
 59
59 -
 60
60 -
 61
61 -
 62
62 -
 63
63 -
 64
64 -
 65
65 -
 66
66 -
 67
67 -
 68
68 -
 69
69 -
 70
70 -
71
-
72
-
73
-
74
-
75
-
76
-
77
-
78
-
79
-
80
-
81
-
82
-
83
-
84
-
85
-
86
-
87
-
88
-
89
-
90
-
91
-
92
-
93
-
94
-
95
-
96
-
97
-
98
-
99
-
100
-
101
-
102
-
103
-
104
-
105
-
106
-
107
-
108
-
109
-
110
-
111
-
112
-
113
-
114
-
115
-
116
-
117
-
118
-
119
-
120
-
121
-
122
-
123
 |
 |

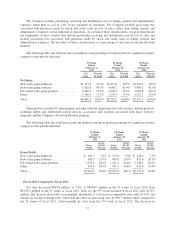
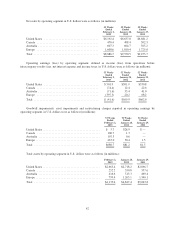
million during fiscal 2011. Excluding the impact of the goodwill and asset impairment charges, adjusted segment
operating earnings remained relatively flat at $69.5 million in fiscal 2012 compared to $70.6 million in fiscal
2011.
Fiscal 2011 Compared to Fiscal 2010
United States
Segment results for the United States include retail operations in 50 states, the District of Columbia, Puerto
Rico and Guam, the electronic commerce Web site www.gamestop.com, Game Informer magazine,
www.kongregate.com, a digital PC game distribution platform available at www.gamestop.com/pcgames and
Spawn Labs. As of January 28, 2012, the United States segment included 4,503 GameStop stores, compared to
4,536 stores on January 29, 2011. Sales for fiscal 2011 decreased 0.7% compared to fiscal 2010 and comparable
store sales decreased 1.2%. Comparable store sales decreased primarily due to decreases in new video game
hardware sales and other product sales offset partially by an increase in pre-owned video game product sales.
Despite the sales decrease, gross margin dollars increased by $88.1 million when compared to fiscal 2010 due to
the higher mix of pre-owned video game product sales and higher other product margin primarily related to our
digital initiatives. Asset impairments and restructuring charges of $28.9 million were recognized in fiscal 2011
primarily related to asset impairments, severance and disposal costs associated with the exit of non-core
businesses. No asset impairments or restructuring charges were recognized in fiscal 2010. Segment operating
income for fiscal 2011 decreased by $28.9 million, or 5.4%, compared to fiscal 2010, an amount equal to the
asset impairments and restructuring charges recognized in fiscal 2011.
Canada
Segment results for Canada include retail operations and an e-commerce site in Canada. Sales in the
Canadian segment in the 52 weeks ended January 28, 2012 decreased 0.8% compared to the 52 weeks ended
January 29, 2011. The decrease in sales was primarily attributable to a decrease in sales at existing stores
partially offset by the impact of changes in exchange rates in fiscal 2011 when compared to fiscal 2010, which
had the effect of increasing sales by $11.8 million. Excluding the impact of changes in exchange rates, sales in
the Canadian segment decreased 3.1%. The decrease in sales at existing stores was primarily due to weak
consumer traffic and a slow-down in hardware unit sell-through and lower price points when compared to fiscal
2010. As of January 28, 2012, the Canadian segment had 346 stores compared to 345 stores as of January 29,
2011. Segment operating income for fiscal 2011 decreased $10.2 million to $12.4 million compared to
$22.6 million for fiscal 2010. The decrease in operating income when compared to the prior year was primarily
due to the decrease in sales at existing stores. The unfavorable impact of changes in exchange rates had the effect
of decreasing operating earnings by $0.3 million when compared to fiscal 2010.
Australia
Segment results for Australia include retail operations and e-commerce sites in Australia and New Zealand.
As of January 28, 2012, the Australian segment included 411 stores, compared to 405 stores as of January 29,
2011. Sales for the 52 weeks ended January 28, 2012 increased 7.0% compared to the 52 weeks ended
January 29, 2011. The increase in sales was primarily attributable to the favorable impact of changes in exchange
rates in fiscal 2011 when compared to fiscal 2010, which had the effect of increasing sales by $54.5 million.
Excluding the impact of changes in exchange rates, sales in the Australian segment decreased 2.7%. The decrease
in sales was primarily due to the decrease in sales at existing stores offset by the additional sales at the 15 stores
opened since January 30, 2011. The decrease in sales at existing stores when compared to fiscal 2010 was
primarily due to a decrease in comparable new video game hardware sales as the current generation of hardware
platforms continues to age.
Segment operating income in fiscal 2011 decreased by $5.6 million to $35.4 million when compared to
$41.0 million in fiscal 2010. The decrease in operating earnings for fiscal 2011 was due to the decrease in sales at
existing stores and the increase in selling, general and administrative expenses associated with the increase in the
45