GameStop 2012 Annual Report Download - page 80
Download and view the complete annual report
Please find page 80 of the 2012 GameStop annual report below. You can navigate through the pages in the report by either clicking on the pages listed below, or by using the keyword search tool below to find specific information within the annual report.-
 1
1 -
2
-
3
-
4
-
5
-
6
-
7
-
8
-
9
-
10
-
11
-
12
-
13
-
14
-
15
-
16
-
17
-
18
-
19
-
20
-
21
-
22
-
23
-
24
-
25
-
26
-
27
-
28
-
29
-
30
-
31
-
32
-
33
-
34
-
35
-
36
-
37
-
38
-
39
-
40
-
41
-
42
-
43
-
44
-
45
-
46
-
47
-
48
-
49
-
50
-
51
-
52
-
53
-
54
-
55
-
56
-
57
-
58
-
59
-
60
-
61
-
62
-
63
-
64
-
65
-
66
-
67
-
68
-
69
-
 70
70 -
 71
71 -
 72
72 -
 73
73 -
 74
74 -
 75
75 -
 76
76 -
 77
77 -
 78
78 -
 79
79 -
 80
80 -
 81
81 -
 82
82 -
 83
83 -
 84
84 -
 85
85 -
 86
86 -
 87
87 -
 88
88 -
 89
89 -
 90
90 -
91
-
92
-
93
-
94
-
95
-
96
-
97
-
98
-
99
-
100
-
101
-
102
-
103
-
104
-
105
-
106
-
107
-
108
-
109
-
110
-
111
-
112
-
113
-
114
-
115
-
116
-
117
-
118
-
119
-
120
-
121
-
122
-
123
 |
 |

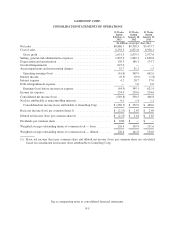
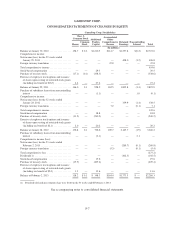
GAMESTOP CORP.
CONSOLIDATED STATEMENTS OF OPERATIONS
53 Weeks
Ended
February 2,
2013
52 Weeks
Ended
January 28,
2012
52 Weeks
Ended
January 29,
2011
(In millions, except per share data)
Net sales ..................................................... $8,886.7 $9,550.5 $9,473.7
Cost of sales .................................................. 6,235.2 6,871.0 6,936.1
Gross profit ................................................. 2,651.5 2,679.5 2,537.6
Selling, general and administrative expenses ......................... 1,835.9 1,842.1 1,698.8
Depreciation and amortization .................................... 176.5 186.3 174.7
Goodwill impairments .......................................... 627.0 — —
Asset impairments and restructuring charges ......................... 53.7 81.2 1.5
Operating earnings (loss) ...................................... (41.6) 569.9 662.6
Interest income ................................................ (0.9) (0.9) (1.8)
Interest expense ............................................... 4.2 20.7 37.0
Debt extinguishment expense ..................................... — 1.0 6.0
Earnings (loss) before income tax expense ........................ (44.9) 549.1 621.4
Income tax expense ............................................. 224.9 210.6 214.6
Consolidated net income (loss) .................................... (269.8) 338.5 406.8
Net loss attributable to noncontrolling interests ....................... 0.1 1.4 1.2
Consolidated net income (loss) attributable to GameStop Corp. ........ $ (269.7) $ 339.9 $ 408.0
Basic net income (loss) per common share(1) ........................ $ (2.13) $ 2.43 $ 2.69
Diluted net income (loss) per common share(1) ...................... $ (2.13) $ 2.41 $ 2.65
Dividends per common share ..................................... $ 0.80 $ — $ —
Weighted average outstanding shares of common stock — basic ......... 126.4 139.9 151.6
Weighted average outstanding shares of common stock — diluted ........ 126.4 141.0 154.0
(1) Basic net income (loss) per common share and diluted net income (loss) per common share are calculated
based on consolidated net income (loss) attributable to GameStop Corp.
See accompanying notes to consolidated financial statements.
F-5