GameStop 2012 Annual Report Download - page 90
Download and view the complete annual report
Please find page 90 of the 2012 GameStop annual report below. You can navigate through the pages in the report by either clicking on the pages listed below, or by using the keyword search tool below to find specific information within the annual report.-
 1
1 -
2
-
3
-
4
-
5
-
6
-
7
-
8
-
9
-
10
-
11
-
12
-
13
-
14
-
15
-
16
-
17
-
18
-
19
-
20
-
21
-
22
-
23
-
24
-
25
-
26
-
27
-
28
-
29
-
30
-
31
-
32
-
33
-
34
-
35
-
36
-
37
-
38
-
39
-
40
-
41
-
42
-
43
-
44
-
45
-
46
-
47
-
48
-
49
-
50
-
51
-
52
-
53
-
54
-
55
-
56
-
57
-
58
-
59
-
60
-
61
-
62
-
63
-
64
-
65
-
66
-
67
-
68
-
69
-
70
-
71
-
72
-
73
-
74
-
75
-
76
-
77
-
78
-
79
-
 80
80 -
 81
81 -
 82
82 -
 83
83 -
 84
84 -
 85
85 -
 86
86 -
 87
87 -
 88
88 -
 89
89 -
 90
90 -
 91
91 -
 92
92 -
 93
93 -
 94
94 -
 95
95 -
 96
96 -
 97
97 -
 98
98 -
 99
99 -
 100
100 -
101
-
102
-
103
-
104
-
105
-
106
-
107
-
108
-
109
-
110
-
111
-
112
-
113
-
114
-
115
-
116
-
117
-
118
-
119
-
120
-
121
-
122
-
123
 |
 |

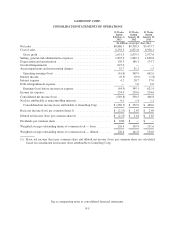
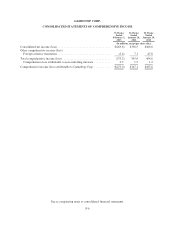
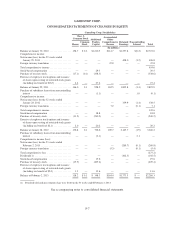
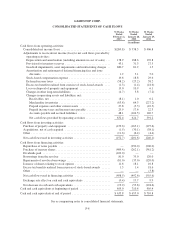
GAMESTOP CORP.
NOTES TO CONSOLIDATED FINANCIAL STATEMENTS — (Continued)
$2.5 million for the 53 weeks ended February 2, 2013 and the 52 weeks ended January 28, 2012 and January 29,
2011, respectively. The foreign currency transaction gains and losses are primarily due to the decrease or
increase in the value of the U.S. dollar compared to the functional currencies in the countries the Company
operates in internationally. The foreign currency transaction gains and (losses) are primarily due to volatility in
the value of the U.S. dollar compared to the Australian dollar, Canadian dollar and euro.
The Company uses forward exchange contracts, foreign currency options and cross-currency swaps
(together, the “Foreign Currency Contracts”) to manage currency risk primarily related to intercompany loans
denominated in non-functional currencies and certain foreign currency assets and liabilities. These Foreign
Currency Contracts are not designated as hedges and, therefore, changes in the fair values of these derivatives are
recognized in earnings, thereby offsetting the current earnings effect of the re-measurement of related
intercompany loans and foreign currency assets and liabilities (see Note 6).
Net Income (Loss) Per Common Share
Basic net income (loss) per common share is computed by dividing the net income (loss) available to
common stockholders by the weighted average number of common shares outstanding during the period. Diluted
net income (loss) per common share is computed by dividing the net income (loss) available to common
stockholders by the weighted average number of common shares outstanding and potentially dilutive securities
outstanding during the period. Potentially dilutive securities include stock options and unvested restricted stock
outstanding during the period, using the treasury stock method. Potentially dilutive securities are excluded from
the computations of diluted earnings per share if their effect would be antidilutive. Note 5 provides additional
information regarding net income (loss) per common share.
Stock Options
The Company records stock-based compensation expense in earnings based on the grant-date fair value of
options granted. The fair value of each option grant is estimated on the date of grant using the Black-Scholes
option pricing model. This valuation model requires the use of subjective assumptions, including expected option
life and expected volatility. The Company uses historical data to estimate the option life and the employee
forfeiture rate, and uses historical volatility when estimating the stock price volatility. There were no stock
options granted during the 53 weeks ended February 2, 2013 and the 52 weeks ended January 28, 2012. The
weighted-average fair value of the options granted during the 52 weeks ended January 29, 2011 was estimated at
$7.88 using the following assumptions:
52 Weeks
Ended
January 29,
2011
Volatility ................................................................ 51.6%
Risk-free interest rate ...................................................... 1.6%
Expected life (years) ....................................................... 3.5
Expected dividend yield .................................................... 0%
In addition to requiring companies to recognize the estimated fair value of stock-based compensation in
earnings over the required service period, companies also have to present tax benefits received in excess of
amounts determined based on the compensation expense recognized on the statements of cash flows. Such tax
benefits are presented as a use of cash in the operating section and a source of cash in the financing section of the
consolidated statements of cash flows. Note 14 provides additional information regarding the Company’s stock
incentive plan.
F-15