GameStop 2012 Annual Report Download - page 115
Download and view the complete annual report
Please find page 115 of the 2012 GameStop annual report below. You can navigate through the pages in the report by either clicking on the pages listed below, or by using the keyword search tool below to find specific information within the annual report.-
 1
1 -
2
-
3
-
4
-
5
-
6
-
7
-
8
-
9
-
10
-
11
-
12
-
13
-
14
-
15
-
16
-
17
-
18
-
19
-
20
-
21
-
22
-
23
-
24
-
25
-
26
-
27
-
28
-
29
-
30
-
31
-
32
-
33
-
34
-
35
-
36
-
37
-
38
-
39
-
40
-
41
-
42
-
43
-
44
-
45
-
46
-
47
-
48
-
49
-
50
-
51
-
52
-
53
-
54
-
55
-
56
-
57
-
58
-
59
-
60
-
61
-
62
-
63
-
64
-
65
-
66
-
67
-
68
-
69
-
70
-
71
-
72
-
73
-
74
-
75
-
76
-
77
-
78
-
79
-
80
-
81
-
82
-
83
-
84
-
85
-
86
-
87
-
88
-
89
-
90
-
91
-
92
-
93
-
94
-
95
-
96
-
97
-
98
-
99
-
100
-
101
-
102
-
103
-
104
-
 105
105 -
 106
106 -
 107
107 -
 108
108 -
 109
109 -
 110
110 -
 111
111 -
 112
112 -
 113
113 -
 114
114 -
 115
115 -
 116
116 -
 117
117 -
 118
118 -
 119
119 -
 120
120 -
 121
121 -
 122
122 -
 123
123
 |
 |

GAMESTOP CORP.
NOTES TO CONSOLIDATED FINANCIAL STATEMENTS — (Continued)
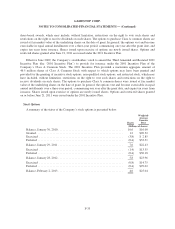
replacing the remaining $180.1 million authorization. For fiscal 2011, the number of shares repurchased was
11.2 million for an average price per share of $21.38. In March 2012, the Board of Directors authorized the
Company to use $500 million to repurchase shares of the Company’s common stock, replacing the remaining
$253.4 million of the November 2011 authorization. In November 2012, the Board of Directors authorized the
Company to use $500 million to repurchase shares of the Company’s common stock, replacing the remaining
$241.6 million of the March 2012 authorization. For fiscal 2012, the number of shares repurchased was
19.9 million for an average price per share of $20.60. As of February 2, 2013, the Company had $425.3 million
remaining under the November 2012 authorization. As of March 25, 2013, the Company has purchased an
additional 1.0 million shares for an average price per share of $25.06, leaving $400.0 million available under the
November 2012 authorization.
On February 8, 2012, the Board of Directors of the Company approved the initiation of a quarterly cash
dividend to its stockholders of Class A Common Stock. The first quarterly cash dividend of $0.15 per share was
paid on March 12, 2012. The second quarterly cash dividend of $0.15 per share was paid on June 12, 2012. The
third quarterly cash dividend of $0.25 per share was paid on September 12, 2012. The fourth quarterly cash
dividend of $0.25 per share was paid on December 12, 2012. On February 18, 2013, the Board of Directors of the
Company approved the quarterly cash dividend to its stockholders of $0.275 per share of Class A Common Stock
payable on March 19, 2013 to stockholders of record at the close of business on March 5, 2013. Future dividends
will be subject to approval by the Board of Directors of the Company.
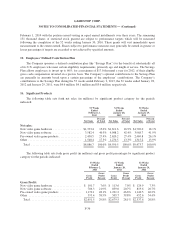
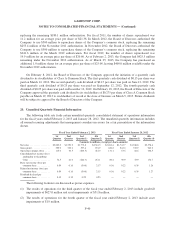
20. Unaudited Quarterly Financial Information
The following table sets forth certain unaudited quarterly consolidated statement of operations information
for the fiscal years ended February 2, 2013 and January 28, 2012. The unaudited quarterly information includes
all normal recurring adjustments that management considers necessary for a fair presentation of the information
shown.
Fiscal Year Ended February 2, 2013 Fiscal Year Ended January 28, 2012
1st
Quarter
2nd
Quarter
3rd
Quarter(1)
4th
Quarter(2)
1st
Quarter
2nd
Quarter
3rd
Quarter(3)
4th
Quarter(4)
(Amounts in millions, except per share amounts)
Net sales ................. $2,002.2 $1,550.2 $1,772.8 $3,561.5 $2,281.4 $1,743.7 $1,946.8 $3,578.6
Gross profit ............... 599.9 519.3 557.4 974.9 620.2 543.2 572.9 943.2
Operating earnings (loss) .... 115.0 34.5 (603.5) 412.3 131.1 53.6 82.6 302.5
Consolidated net income (loss)
attributable to GameStop
Corp. .................. 72.5 21.0 (624.3) 261.1 80.4 30.9 53.9 174.7
Basic net income (loss) per
common share ........... 0.54 0.16 (5.08) 2.17 0.56 0.22 0.39 1.28
Diluted net income (loss) per
common share ........... 0.54 0.16 (5.08) 2.15 0.56 0.22 0.39 1.27
Dividend declared per
common share ........... 0.15 0.15 0.25 0.25 — — — —
The following footnotes are discussed as pretax expenses.
(1) The results of operations for the third quarter of the fiscal year ended February 2, 2013 include goodwill
impairments of $627.0 million and asset impairments of $51.8 million.
(2) The results of operations for the fourth quarter of the fiscal year ended February 2, 2013 include asset
impairments of $1.9 million.
F-40