GameStop 2012 Annual Report Download - page 55
Download and view the complete annual report
Please find page 55 of the 2012 GameStop annual report below. You can navigate through the pages in the report by either clicking on the pages listed below, or by using the keyword search tool below to find specific information within the annual report.-
 1
1 -
2
-
3
-
4
-
5
-
6
-
7
-
8
-
9
-
10
-
11
-
12
-
13
-
14
-
15
-
16
-
17
-
18
-
19
-
20
-
21
-
22
-
23
-
24
-
25
-
26
-
27
-
28
-
29
-
30
-
31
-
32
-
33
-
34
-
35
-
36
-
37
-
38
-
39
-
40
-
41
-
42
-
43
-
44
-
 45
45 -
 46
46 -
 47
47 -
 48
48 -
 49
49 -
 50
50 -
 51
51 -
 52
52 -
 53
53 -
 54
54 -
 55
55 -
 56
56 -
 57
57 -
 58
58 -
 59
59 -
 60
60 -
 61
61 -
 62
62 -
 63
63 -
 64
64 -
 65
65 -
66
-
67
-
68
-
69
-
70
-
71
-
72
-
73
-
74
-
75
-
76
-
77
-
78
-
79
-
80
-
81
-
82
-
83
-
84
-
85
-
86
-
87
-
88
-
89
-
90
-
91
-
92
-
93
-
94
-
95
-
96
-
97
-
98
-
99
-
100
-
101
-
102
-
103
-
104
-
105
-
106
-
107
-
108
-
109
-
110
-
111
-
112
-
113
-
114
-
115
-
116
-
117
-
118
-
119
-
120
-
121
-
122
-
123
 |
 |
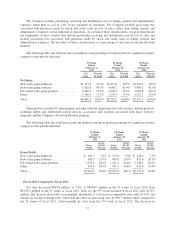
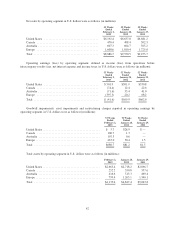
52 weeks of fiscal 2010 and the increase of non-comparable store sales from the increase in net store count of
233 stores since January 30, 2010, offset partially by a decrease in comparable store sales of 2.1%. The decrease
in comparable store sales was primarily due to a decrease in comparable new video game hardware sales as the
current generation of hardware platforms continues to age.
New video game hardware sales decreased $108.4 million, or 6.3%, from fiscal 2010 to fiscal 2011,
primarily due to a decrease in hardware unit sell-through, primarily in the Nintendo Wii and handheld categories,
partially offset by the launch of the Nintendo 3DS. New video game software sales increased $79.5 million, or
2.0%, from fiscal 2010 to fiscal 2011, primarily due to changes in foreign exchange rates. Pre-owned video game
products sales increased $150.4 million, or 6.1%, from fiscal 2010 to fiscal 2011, primarily due to increased
promotional efforts using our PowerUp Rewards program and changes in merchandising. Sales of other product
categories decreased $44.7 million, or 3.4%, from fiscal 2010 to fiscal 2011. The decrease in other product sales
was primarily due to the decrease in sales of new release PC entertainment software titles and the shift in digital
sales from inventoriable pre-purchased product, recorded as revenue at the retail price, to non-inventoriable
digitally downloadable content, recorded as revenue on a commission basis, offset partially by changes in foreign
exchange rates.
As a percentage of net sales, new video game software sales and pre-owned video game products sales
increased, while new video game hardware sales and other product sales decreased, from fiscal 2010 to fiscal
2011. The change in the mix of net sales was primarily due to the increase in pre-owned video game product
sales as discussed above and the decrease in new video game hardware sales due to the continued aging of the
current generation of hardware platforms.
Cost of sales decreased by $65.1 million, or 0.9%, from $6,936.1 million in fiscal 2010 to $6,871.0 million
in fiscal 2011 as a result of the changes in gross profit discussed below.
Gross profit increased by $141.9 million, or 5.6%, from $2,537.6 million in fiscal 2010 to $2,679.5 million
in fiscal 2011. Gross profit as a percentage of net sales was 26.8% in fiscal 2010 and 28.1% in fiscal 2011. The
gross profit percentage increase was primarily due to the increase in sales of pre-owned video game products as a
percentage of total net sales and the increase in gross profit as a percentage of sales on other products, including
the increase in sales of digital products, from fiscal 2010 to fiscal 2011. Gross profit as a percentage of sales on
new video game hardware decreased slightly from 7.3% in fiscal 2010 to 7.0% in fiscal 2011. Gross profit as a
percentage of sales on new video game software stayed constant at 20.7% for fiscal 2010 and fiscal 2011. Gross
profit as a percentage of sales on pre-owned video game products increased from 46.2% in fiscal 2010 to 46.6%
in fiscal 2011 due to decreased promotional activities in the holiday selling season. Gross profit as a percentage
of sales on the other product sales category increased from 34.4% in fiscal 2010 to 39.8% in fiscal 2011
primarily due to a shift in sales to higher margin digital products, some of which are recorded on a commission
basis at 100% margin, and growth in sales of PowerUp Rewards Pro memberships and related Game
Informer subscriptions that also have higher margins than PC entertainment software and accessories.
Selling, general and administrative expenses increased by $143.3 million, or 8.4%, from $1,698.8 million in
fiscal 2010 to $1,842.1 million in fiscal 2011. This increase was attributable to changes in foreign exchange rates
which had the effect of increasing expenses by $29.0 million when compared to fiscal 2010, as well as additional
expenses incurred in support of our digital and loyalty initiatives. Selling, general and administrative expenses as
a percentage of net sales increased from 18.0% in the fiscal 2010 to 19.3% in fiscal 2011. The increase in selling,
general and administrative expenses as a percentage of net sales was primarily due to deleveraging of fixed costs
as a result of the decrease in comparable store sales and the additional expenses incurred in support of our digital
and loyalty initiatives in fiscal 2011. Included in selling, general and administrative expenses are $18.8 million
and $29.6 million in stock-based compensation expense for fiscal 2011 and fiscal 2010, respectively.
Depreciation and amortization expense increased $11.6 million from $174.7 million in fiscal 2010 to
$186.3 million in fiscal 2011. This increase was primarily due to the capital expenditures associated with the
opening of 285 new stores during fiscal 2011 and investments in management information systems, including
investments in digital and loyalty initiatives.
40