GameStop 2012 Annual Report Download - page 18
Download and view the complete annual report
Please find page 18 of the 2012 GameStop annual report below. You can navigate through the pages in the report by either clicking on the pages listed below, or by using the keyword search tool below to find specific information within the annual report.-
 1
1 -
2
-
3
-
4
-
5
-
6
-
7
-
 8
8 -
 9
9 -
 10
10 -
 11
11 -
 12
12 -
 13
13 -
 14
14 -
 15
15 -
 16
16 -
 17
17 -
 18
18 -
 19
19 -
 20
20 -
 21
21 -
 22
22 -
 23
23 -
 24
24 -
 25
25 -
 26
26 -
 27
27 -
 28
28 -
29
-
30
-
31
-
32
-
33
-
34
-
35
-
36
-
37
-
38
-
39
-
40
-
41
-
42
-
43
-
44
-
45
-
46
-
47
-
48
-
49
-
50
-
51
-
52
-
53
-
54
-
55
-
56
-
57
-
58
-
59
-
60
-
61
-
62
-
63
-
64
-
65
-
66
-
67
-
68
-
69
-
70
-
71
-
72
-
73
-
74
-
75
-
76
-
77
-
78
-
79
-
80
-
81
-
82
-
83
-
84
-
85
-
86
-
87
-
88
-
89
-
90
-
91
-
92
-
93
-
94
-
95
-
96
-
97
-
98
-
99
-
100
-
101
-
102
-
103
-
104
-
105
-
106
-
107
-
108
-
109
-
110
-
111
-
112
-
113
-
114
-
115
-
116
-
117
-
118
-
119
-
120
-
121
-
122
-
123
 |
 |
• alternate sources of distribution of video game software and content;
• alternate means to play video games;
• the competitive environment in the electronic game industry;
• the growth of mobile, social and browser gaming;
• our ability to open and operate new stores and to efficiently close underperforming stores;
• our ability to attract and retain qualified personnel;
• our ability to effectively integrate and operate acquired companies, including digital gaming and
technology-based companies that are outside of the Company’s historical operating expertise;
• the impact and costs of litigation and regulatory compliance;
• unanticipated litigation results, including third party litigation;
• the risks involved with our international operations, including continued efforts to consolidate back-office
support and close under-performing stores; and
• other factors described in this Form 10-K, including those set forth under the caption “Item 1A. Risk
Factors.”
In some cases, forward-looking statements can be identified by the use of terms such as “anticipates,”
“believes,” “continues,” “could,” “estimates,” “expects,” “intends,” “may,” “plans,” “potential,” “predicts,” “pro
forma,” “seeks,” “should,” “will” or similar expressions. These statements are only predictions based on current
expectations and assumptions and involve known and unknown risks, uncertainties and other factors that may
cause our or our industry’s actual results, levels of activity, performance or achievements to be materially
different from any future results, levels of activity, performance or achievements expressed or implied by such
forward-looking statements. You should not place undue reliance on these forward-looking statements.
Although we believe that the expectations reflected in our forward-looking statements are reasonable, we
cannot guarantee future results, levels of activity, performance or achievements. We undertake no obligation to
publicly update or revise any forward-looking statements, whether as a result of new information, future events
or otherwise after the date of this Form 10-K. In light of these risks and uncertainties, the forward-looking events
and circumstances contained in this Form 10-K may not occur, causing actual results to differ materially from
those anticipated or implied by our forward-looking statements.
Industry Background
Based upon estimates compiled by various market research firms, management estimates that the combined
market for physical video game products and PC entertainment software was approximately $25 billion in 2012
in the parts of the world in which we operate. According to NPD Group, Inc., a market research firm (the “NPD
Group”), the electronic game industry was an approximately $13 billion market in the United States in 2012, the
majority of which was attributable to physical video game products, excluding sales of pre-owned video game
products. International Development Group, a market research firm (“IDG”), estimates that retail sales of video
game hardware and software and PC entertainment software totaled approximately $9.4 billion in Europe in
2012. For 2012, the NPD Group reported that video game retail sales were approximately $1.2 billion in Canada
and $1.2 billion in the Australian market.
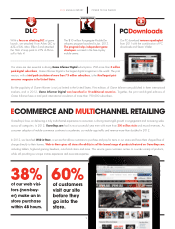
Based on internal estimates compiled from a group of third-party sources, we believe the North American
market for digital game sales, including mobile, social, console and PC games, was approximately $7 billion in
2012 and this market is expected to grow to $10 billion to $12 billion by 2015.
3