GameStop 2012 Annual Report Download - page 5
Download and view the complete annual report
Please find page 5 of the 2012 GameStop annual report below. You can navigate through the pages in the report by either clicking on the pages listed below, or by using the keyword search tool below to find specific information within the annual report.-
 1
1 -
 2
2 -
 3
3 -
 4
4 -
 5
5 -
 6
6 -
 7
7 -
 8
8 -
 9
9 -
 10
10 -
 11
11 -
 12
12 -
 13
13 -
 14
14 -
 15
15 -
 16
16 -
17
-
18
-
19
-
20
-
21
-
22
-
23
-
24
-
25
-
26
-
27
-
28
-
29
-
30
-
31
-
32
-
33
-
34
-
35
-
36
-
37
-
38
-
39
-
40
-
41
-
42
-
43
-
44
-
45
-
46
-
47
-
48
-
49
-
50
-
51
-
52
-
53
-
54
-
55
-
56
-
57
-
58
-
59
-
60
-
61
-
62
-
63
-
64
-
65
-
66
-
67
-
68
-
69
-
70
-
71
-
72
-
73
-
74
-
75
-
76
-
77
-
78
-
79
-
80
-
81
-
82
-
83
-
84
-
85
-
86
-
87
-
88
-
89
-
90
-
91
-
92
-
93
-
94
-
95
-
96
-
97
-
98
-
99
-
100
-
101
-
102
-
103
-
104
-
105
-
106
-
107
-
108
-
109
-
110
-
111
-
112
-
113
-
114
-
115
-
116
-
117
-
118
-
119
-
120
-
121
-
122
-
123
 |
 |
2012 ANNUAL REPORT POWER TO THE PLAYERS
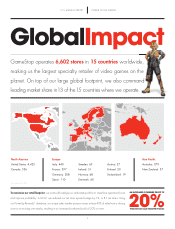
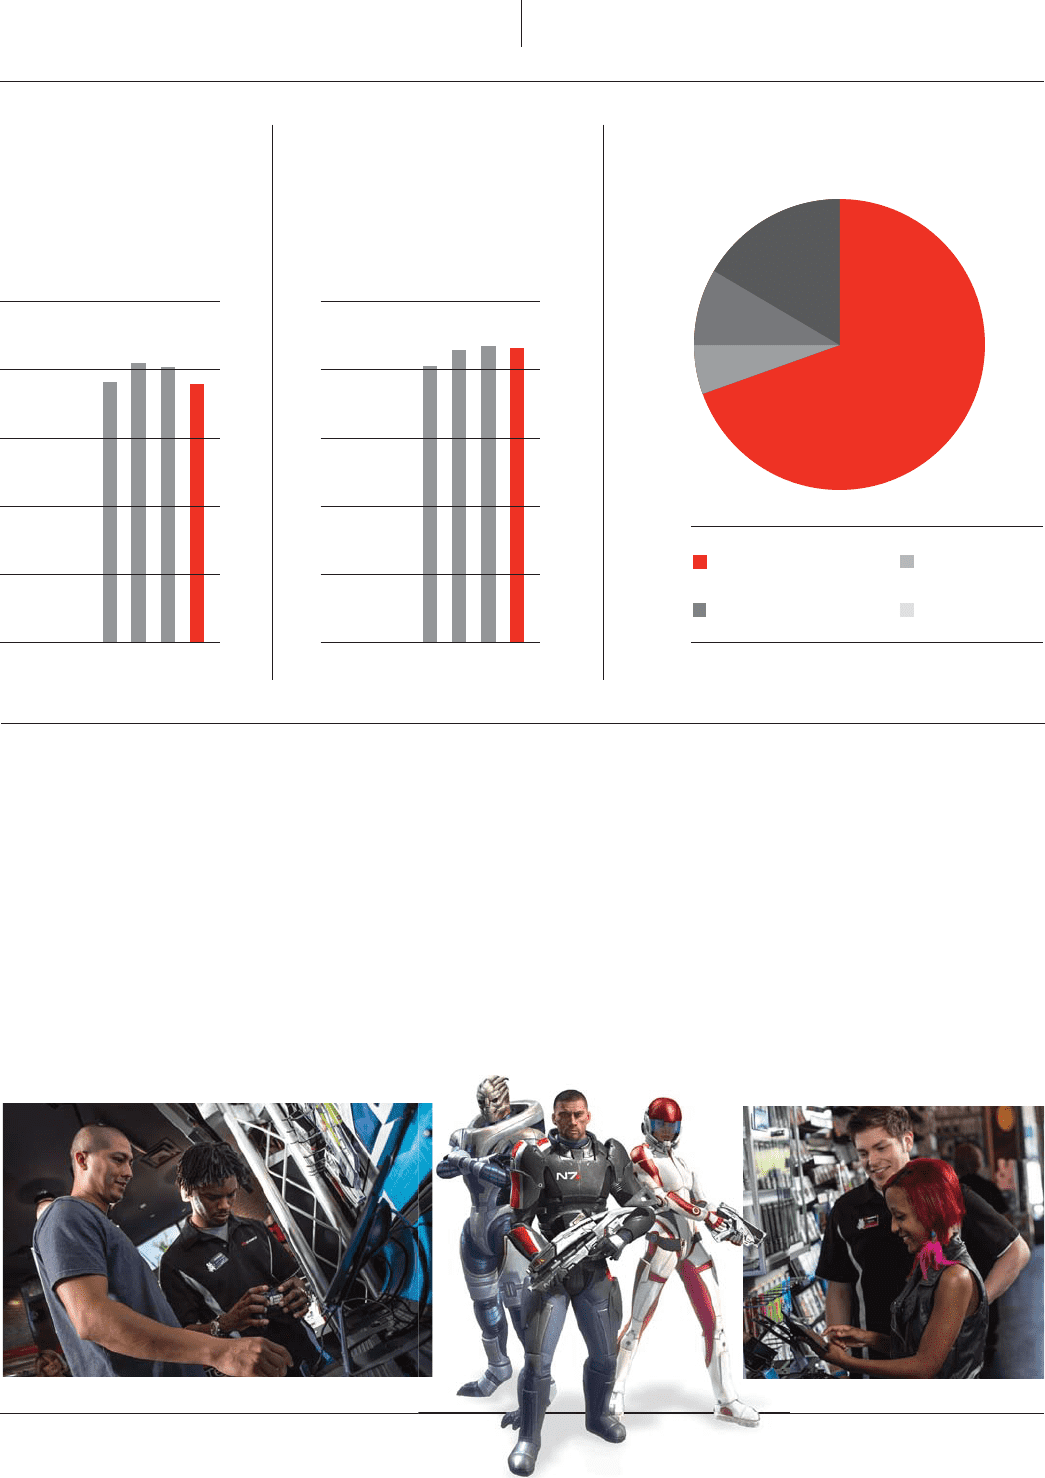
Canada: $478.4Europe: $1,608.6
United States: $6,192.4
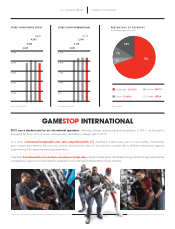
GAMESTOP INTERNATIONAL
2012 was a standout year for our international operations. Following strategic restructuring and consolidation in 2011, we focused on
managing the basics of our business and executing GameStop’s strategic plan in 2012.
As a result, international comparable store sales outperformed the U.S., leading to market share gains in most markets. Additionally,
gross margin improvements, focus on cost controls and continued rollout of new business initiatives led to all three international segments
outperforming their operating earnings expectations.
GameStop International also increased pre-owned gross margin rates to levels commensurate with domestic margins thanks to improved inventory
management, expansion of refurbishment capabilities and continued implementation of best practices.
STORE COUNT UNITED STATES STORE COUNT INTERNATIONAL
3,000 500
3,500 1,000
4,000 1,500
4,500 2,000
5,000 2,500
4,503 2,180
4,425 2,177
4,536 2,134
4,429 2,021
09 0910 1011 1112 12
PERCENTAGE OF REVENUES
by Operating Segments for 2012
Australia: $607.3
Revenue in millions. Store count as of Feb. 2, 2013. Store count as of Feb. 2, 2013.
70%
18%
7%
5%
3