GameStop 2012 Annual Report Download - page 57
Download and view the complete annual report
Please find page 57 of the 2012 GameStop annual report below. You can navigate through the pages in the report by either clicking on the pages listed below, or by using the keyword search tool below to find specific information within the annual report.-
 1
1 -
2
-
3
-
4
-
5
-
6
-
7
-
8
-
9
-
10
-
11
-
12
-
13
-
14
-
15
-
16
-
17
-
18
-
19
-
20
-
21
-
22
-
23
-
24
-
25
-
26
-
27
-
28
-
29
-
30
-
31
-
32
-
33
-
34
-
35
-
36
-
37
-
38
-
39
-
40
-
41
-
42
-
43
-
44
-
45
-
46
-
 47
47 -
 48
48 -
 49
49 -
 50
50 -
 51
51 -
 52
52 -
 53
53 -
 54
54 -
 55
55 -
 56
56 -
 57
57 -
 58
58 -
 59
59 -
 60
60 -
 61
61 -
 62
62 -
 63
63 -
 64
64 -
 65
65 -
 66
66 -
 67
67 -
68
-
69
-
70
-
71
-
72
-
73
-
74
-
75
-
76
-
77
-
78
-
79
-
80
-
81
-
82
-
83
-
84
-
85
-
86
-
87
-
88
-
89
-
90
-
91
-
92
-
93
-
94
-
95
-
96
-
97
-
98
-
99
-
100
-
101
-
102
-
103
-
104
-
105
-
106
-
107
-
108
-
109
-
110
-
111
-
112
-
113
-
114
-
115
-
116
-
117
-
118
-
119
-
120
-
121
-
122
-
123
 |
 |

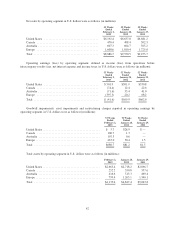
Net sales by operating segment in U.S. dollars were as follows (in millions):
53 Weeks
Ended
February 2,
2013
52 Weeks
Ended
January 28,
2012
52 Weeks
Ended
January 29,
2011
United States ..................................... $6,192.4 $6,637.0 $6,681.2
Canada .......................................... 478.4 498.4 502.3
Australia ......................................... 607.3 604.7 565.2
Europe .......................................... 1,608.6 1,810.4 1,725.0
Total ............................................ $8,886.7 $9,550.5 $9,473.7
Operating earnings (loss) by operating segment, defined as income (loss) from operations before
intercompany royalty fees, net interest expense and income taxes, in U.S. dollars were as follows (in millions):
53 Weeks
Ended
February 2,
2013
52 Weeks
Ended
January 28,
2012
52 Weeks
Ended
January 29,
2011
United States ..................................... $501.9 $501.9 $530.8
Canada .......................................... (74.4) 12.4 22.6
Australia ......................................... (71.6) 35.4 41.0
Europe .......................................... (397.5) 20.2 68.2
Total ............................................ $ (41.6) $569.9 $662.6
Goodwill impairments, asset impairments and restructuring charges reported in operating earnings by
operating segment, in U.S. dollars were as follows (in millions):
53 Weeks
Ended
February 2,
2013
52 Weeks
Ended
January 28,
2012
52 Weeks
Ended
January 29,
2011
United States ....................................... $ 5.7 $28.9 $ —
Canada ........................................... 100.7 1.3 —
Australia .......................................... 107.3 0.6 —
Europe ............................................ 467.0 50.4 1.5
Total ............................................. $680.7 $81.2 $1.5
Total assets by operating segment in U.S. dollars were as follows (in millions):
February 2,
2013
January 28,
2012
January 29,
2011
United States ....................................... $2,665.4 $2,718.2 $2,896.7
Canada ........................................... 252.2 350.8 357.6
Australia .......................................... 416.6 513.3 469.4
Europe ............................................ 799.4 1,265.1 1,340.1
Total ............................................. $4,133.6 $4,847.4 $5,063.8
42