GameStop 2012 Annual Report Download - page 111
Download and view the complete annual report
Please find page 111 of the 2012 GameStop annual report below. You can navigate through the pages in the report by either clicking on the pages listed below, or by using the keyword search tool below to find specific information within the annual report.-
 1
1 -
2
-
3
-
4
-
5
-
6
-
7
-
8
-
9
-
10
-
11
-
12
-
13
-
14
-
15
-
16
-
17
-
18
-
19
-
20
-
21
-
22
-
23
-
24
-
25
-
26
-
27
-
28
-
29
-
30
-
31
-
32
-
33
-
34
-
35
-
36
-
37
-
38
-
39
-
40
-
41
-
42
-
43
-
44
-
45
-
46
-
47
-
48
-
49
-
50
-
51
-
52
-
53
-
54
-
55
-
56
-
57
-
58
-
59
-
60
-
61
-
62
-
63
-
64
-
65
-
66
-
67
-
68
-
69
-
70
-
71
-
72
-
73
-
74
-
75
-
76
-
77
-
78
-
79
-
80
-
81
-
82
-
83
-
84
-
85
-
86
-
87
-
88
-
89
-
90
-
91
-
92
-
93
-
94
-
95
-
96
-
97
-
98
-
99
-
100
-
 101
101 -
 102
102 -
 103
103 -
 104
104 -
 105
105 -
 106
106 -
 107
107 -
 108
108 -
 109
109 -
 110
110 -
 111
111 -
 112
112 -
 113
113 -
 114
114 -
 115
115 -
 116
116 -
 117
117 -
 118
118 -
 119
119 -
 120
120 -
 121
121 -
122
-
123
 |
 |

GAMESTOP CORP.
NOTES TO CONSOLIDATED FINANCIAL STATEMENTS — (Continued)
February 1, 2014 with the portion earned vesting in equal annual installments over three years. The remaining
131 thousand shares of restricted stock granted are subject to performance targets which will be measured
following the completion of the 52 weeks ending January 30, 2016. These grants will vest immediately upon
measurement to the extent earned. Shares subject to performance measures may generally be earned in greater or
lesser percentages if targets are exceeded or not achieved by specified amounts.
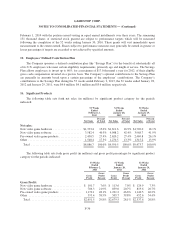
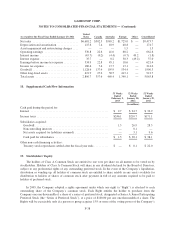
15. Employees’ Defined Contribution Plan
The Company sponsors a defined contribution plan (the “Savings Plan”) for the benefit of substantially all
of its U.S. employees who meet certain eligibility requirements, primarily age and length of service. The Savings
Plan allows employees to invest up to 60%, for a maximum of $17.0 thousand a year for 2012, of their eligible
gross cash compensation invested on a pre-tax basis. The Company’s optional contributions to the Savings Plan
are generally in amounts based upon a certain percentage of the employees’ contributions. The Company’s
contributions to the Savings Plan during the 53 weeks ended February 2, 2013, the 52 weeks ended January 28,
2012 and January 29, 2011, were $4.6 million, $4.1 million and $3.6 million, respectively.
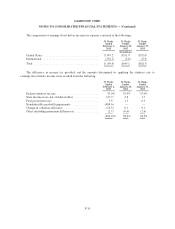
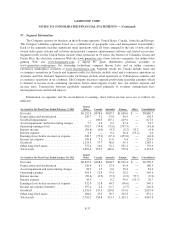
16. Significant Products
The following table sets forth net sales (in millions) by significant product category for the periods
indicated:
53 Weeks
Ended
February 2,
2013
52 Weeks
Ended
January 28,
2012
52 Weeks
Ended
January 29,
2011
Net Sales
Percent
of Total Net Sales
Percent
of Total Net Sales
Percent
of Total
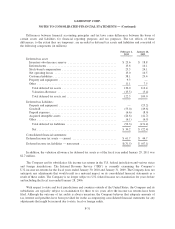
Net sales:
New video game hardware ................... $1,333.4 15.0% $1,611.6 16.9% $1,720.0 18.1%
New video game software ................... 3,582.4 40.3% 4,048.2 42.4% 3,968.7 41.9%
Pre-owned video game products ............... 2,430.5 27.4% 2,620.2 27.4% 2,469.8 26.1%
Other .................................... 1,540.4 17.3% 1,270.5 13.3% 1,315.2 13.9%
Total .................................. $8,886.7 100.0% $9,550.5 100.0% $9,473.7 100.0%
The following table sets forth gross profit (in millions) and gross profit percentages by significant product
category for the periods indicated:
53 Weeks
Ended
February 2,
2013
52 Weeks
Ended
January 28,
2012
52 Weeks
Ended
January 29,
2011
Gross
Profit
Gross
Profit
Percent
Gross
Profit
Gross
Profit
Percent
Gross
Profit
Gross
Profit
Percent
Gross Profit:
New video game hardware ................... $ 101.7 7.6% $ 113.6 7.0% $ 124.9 7.3%
New video game software .................... 786.3 21.9% 839.0 20.7% 819.6 20.7%
Pre-owned video game products ............... 1,170.1 48.1% 1,221.2 46.6% 1,140.5 46.2%
Other .................................... 593.4 38.5% 505.7 39.8% 452.6 34.4%
Total ................................... $2,651.5 29.8% $2,679.5 28.1% $2,537.6 26.8%
F-36