GameStop 2012 Annual Report Download - page 56
Download and view the complete annual report
Please find page 56 of the 2012 GameStop annual report below. You can navigate through the pages in the report by either clicking on the pages listed below, or by using the keyword search tool below to find specific information within the annual report.-
 1
1 -
2
-
3
-
4
-
5
-
6
-
7
-
8
-
9
-
10
-
11
-
12
-
13
-
14
-
15
-
16
-
17
-
18
-
19
-
20
-
21
-
22
-
23
-
24
-
25
-
26
-
27
-
28
-
29
-
30
-
31
-
32
-
33
-
34
-
35
-
36
-
37
-
38
-
39
-
40
-
41
-
42
-
43
-
44
-
45
-
 46
46 -
 47
47 -
 48
48 -
 49
49 -
 50
50 -
 51
51 -
 52
52 -
 53
53 -
 54
54 -
 55
55 -
 56
56 -
 57
57 -
 58
58 -
 59
59 -
 60
60 -
 61
61 -
 62
62 -
 63
63 -
 64
64 -
 65
65 -
 66
66 -
67
-
68
-
69
-
70
-
71
-
72
-
73
-
74
-
75
-
76
-
77
-
78
-
79
-
80
-
81
-
82
-
83
-
84
-
85
-
86
-
87
-
88
-
89
-
90
-
91
-
92
-
93
-
94
-
95
-
96
-
97
-
98
-
99
-
100
-
101
-
102
-
103
-
104
-
105
-
106
-
107
-
108
-
109
-
110
-
111
-
112
-
113
-
114
-
115
-
116
-
117
-
118
-
119
-
120
-
121
-
122
-
123
 |
 |
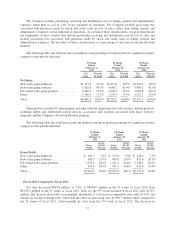
During fiscal 2011, the Company recorded asset impairments and restructuring charges of $81.2 million.
These charges were primarily due to impairment of the Company’s Micromania trade name in France and
impairment and disposal costs related to the exit of non-core businesses, primarily a small retail movie chain of
stores owned by the Company until fiscal 2011. Restructuring costs include disposal and exit costs related to the
exit of underperforming regions in Europe and consolidation of home office and back office functions, as well as
impairment and store closure costs primarily in the international segments.
Interest income resulting from the investment of excess cash balances decreased from $1.8 million in fiscal
2010 to $0.9 million in fiscal 2011 due primarily to lower invested cash balances and lower interest rates during
fiscal 2011. Interest expense decreased from $37.0 million in fiscal 2010 to $20.7 million in fiscal 2011,
primarily due to the redemption of $250.0 and $200.0 million of the Company’s senior notes during fiscal 2011
and fiscal 2010, respectively. Debt extinguishment expense of $1.0 million was recognized in fiscal 2011 as a
result of the recognition of deferred financing fees and unamortized original issue discount. Debt extinguishment
expense of $6.0 million was recognized in fiscal 2010 as a result of premiums paid related to debt retirement and
the recognition of deferred financing fees and unamortized original issue discount.
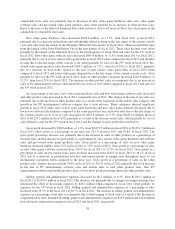
Income tax expense decreased by $4.0 million, from $214.6 million in fiscal 2010 to $210.6 million in fiscal
2011. The Company’s effective tax rate increased from 34.5% in fiscal 2010 to 38.4% in fiscal 2011 due
primarily to the variability in the accounting for the Company’s uncertain tax positions and the effect of asset
impairments and restructuring charges on the tax rate in fiscal 2011 due to certain charges which have no tax
benefits. See Note 13 of “Notes to Consolidated Financial Statements” for additional information regarding
income taxes.
The factors described above led to a decrease in operating earnings of $92.7 million, or 14.0%, from
$662.6 million in fiscal 2010 to $569.9 million in fiscal 2011 and a decrease in consolidated net income of
$68.3 million, or 16.8%, from $406.8 million in fiscal 2010 to $338.5 million in fiscal 2011.
The $1.4 million and $1.2 million net loss attributable to noncontrolling interests for fiscal 2011 and fiscal
2010, respectively, represents the portion of the minority interest stockholders’ net loss of the Company’s non-
wholly owned subsidiaries included in the Company’s consolidated net income.
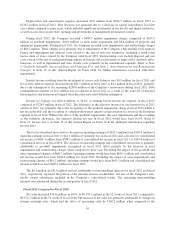
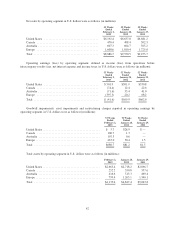
Segment Performance
The Company operates its business in the following operating segments: United States, Canada, Australia
and Europe. We identified these segments based on a combination of geographic areas, the methods with which
we analyze performance, the way in which our sales and profits are derived and how we divide management
responsibility. Our sales and profits are driven through our physical stores which are highly integrated with our
e-commerce, digital and mobile businesses. Due to this integration, our physical stores are the basis for our
segment reporting. Each of the segments consists primarily of retail operations, with all stores engaged in the sale
of new and pre-owned video game systems, software and accessories (which we refer to as video game products)
and PC entertainment software, new and pre-owned mobile devices and related accessories. These products are
substantially the same regardless of geographic location, with the primary differences in merchandise carried
being the timing of the release of new products or technologies in the various segments. Stores in all segments
are similar in size at an average of approximately 1,400 square feet.
With our presence in international markets, the Company has operations in several foreign currencies,
including the euro, Australian dollar, New Zealand dollar, Canadian dollar, British pound, Swiss franc, Danish
kroner, Swedish krona, and the Norwegian kroner.
41