GameStop 2012 Annual Report Download - page 61
Download and view the complete annual report
Please find page 61 of the 2012 GameStop annual report below. You can navigate through the pages in the report by either clicking on the pages listed below, or by using the keyword search tool below to find specific information within the annual report.-
 1
1 -
2
-
3
-
4
-
5
-
6
-
7
-
8
-
9
-
10
-
11
-
12
-
13
-
14
-
15
-
16
-
17
-
18
-
19
-
20
-
21
-
22
-
23
-
24
-
25
-
26
-
27
-
28
-
29
-
30
-
31
-
32
-
33
-
34
-
35
-
36
-
37
-
38
-
39
-
40
-
41
-
42
-
43
-
44
-
45
-
46
-
47
-
48
-
49
-
50
-
 51
51 -
 52
52 -
 53
53 -
 54
54 -
 55
55 -
 56
56 -
 57
57 -
 58
58 -
 59
59 -
 60
60 -
 61
61 -
 62
62 -
 63
63 -
 64
64 -
 65
65 -
 66
66 -
 67
67 -
 68
68 -
 69
69 -
 70
70 -
 71
71 -
72
-
73
-
74
-
75
-
76
-
77
-
78
-
79
-
80
-
81
-
82
-
83
-
84
-
85
-
86
-
87
-
88
-
89
-
90
-
91
-
92
-
93
-
94
-
95
-
96
-
97
-
98
-
99
-
100
-
101
-
102
-
103
-
104
-
105
-
106
-
107
-
108
-
109
-
110
-
111
-
112
-
113
-
114
-
115
-
116
-
117
-
118
-
119
-
120
-
121
-
122
-
123
 |
 |
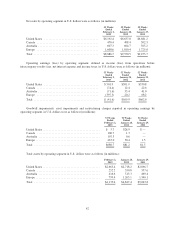
number of stores in operation. This decrease in operating earnings was partially offset by the favorable impact of
changes in exchange rates which had the effect of increasing operating earnings by $1.7 million when compared
to fiscal 2010.
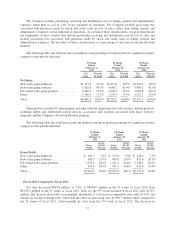
Europe
Segment results for Europe include retail operations in 13 European countries and e-commerce operations in
six countries. As of January 28, 2012, the European segment operated 1,423 stores, compared to 1,384 stores as
of January 29, 2011. For the 52 weeks ended January 28, 2012, European sales increased 5.0% compared to the
52 weeks ended January 29, 2011. This increase in sales was primarily due to the favorable impact of changes in
exchange rates in fiscal 2011, which had the effect of increasing sales by $73.8 million when compared to fiscal
2010. Excluding the impact of changes in exchange rates, sales in the European segment increased 0.7%. The
increase in sales was primarily due to additional sales in the 89 new stores opened since January 30, 2011,
partially offset by a decrease in sales at existing stores. The decrease in sales at existing stores was primarily
driven by weak consumer traffic due to the continued macroeconomic uncertainty and a decrease in comparable
new video game hardware sales as the current generation of hardware platforms continues to age.
The segment operating income in Europe for fiscal 2011 decreased by $48.0 million to $20.2 million
compared to $68.2 million in fiscal 2010. The decrease in the operating income was primarily due to the impact
of asset impairments and restructuring charges of $50.4 million, consisting primarily of the impairment of the
Micromania trade name in the amount of $37.8 million. The remaining amount of $12.6 million consists of
property and equipment impairments, other asset impairments, termination benefits, and facility closure and other
costs.
Liquidity and Capital Resources
Cash Flows
During fiscal 2012, cash provided by operations was $632.4 million, compared to cash provided by
operations of $624.7 million in fiscal 2011. The increase in cash provided by operations of $7.7 million from
fiscal 2011 to fiscal 2012 was primarily due to an increase in cash provided by working capital of $54.8 million,
primarily driven by a change in the timing of payments of accounts payable and other prepaid expenses, offset
partially by higher inventory purchases in fiscal 2012. The higher inventory purchases in fiscal 2012 were
primarily due to purchases to support the Company’s new mobile business. This increase in cash provided by
working capital was partially offset by a decrease in cash from net earnings after adjusting for non-cash items.
During fiscal 2011, cash provided by operations was $624.7 million, compared to cash provided by
operations of $591.2 million in fiscal 2010. The increase in cash provided by operations of $33.5 million from
fiscal 2010 to fiscal 2011 was primarily due to a decrease in cash used for working capital purposes of $49.6
million, primarily driven by lower inventory purchases in fiscal 2011 and the related effects on payments of
accounts payable. The lower inventory purchases were due to lower hardware sales in fiscal 2011, and inventory
management initiatives. Inventory turnover was relatively consistent from fiscal 2010 to fiscal 2011. Also
contributing to the change in cash flows from operating activities for fiscal 2011 compared to fiscal 2010 was the
increase in accrued liabilities, including customer liabilities, primarily related to the growth of the Company’s
PowerUp Rewards program.
Cash used in investing activities was $152.7 million in fiscal 2012, $201.6 million in fiscal 2011 and
$240.1 million in fiscal 2010. During fiscal 2012, the Company used $139.6 million for capital expenditures
primarily to open 146 stores in the U.S. and internationally and to invest in information systems and digital
initiatives. During fiscal 2011, the Company used $165.1 million for capital expenditures primarily to invest in
information systems, distribution center capacity and e-commerce, digital and loyalty program initiatives and to
open 285 stores in the U.S. and internationally. In addition, during fiscal 2011, the Company used $30.1 million
for acquisitions in support of the Company’s digital initiatives. During fiscal 2010, the Company used
$197.6 million for capital expenditures primarily to open 359 stores and to invest in information systems and
$38.1 million for acquisitions in support of the Company’s digital initiatives.
46