GameStop 2012 Annual Report Download - page 112
Download and view the complete annual report
Please find page 112 of the 2012 GameStop annual report below. You can navigate through the pages in the report by either clicking on the pages listed below, or by using the keyword search tool below to find specific information within the annual report.-
 1
1 -
2
-
3
-
4
-
5
-
6
-
7
-
8
-
9
-
10
-
11
-
12
-
13
-
14
-
15
-
16
-
17
-
18
-
19
-
20
-
21
-
22
-
23
-
24
-
25
-
26
-
27
-
28
-
29
-
30
-
31
-
32
-
33
-
34
-
35
-
36
-
37
-
38
-
39
-
40
-
41
-
42
-
43
-
44
-
45
-
46
-
47
-
48
-
49
-
50
-
51
-
52
-
53
-
54
-
55
-
56
-
57
-
58
-
59
-
60
-
61
-
62
-
63
-
64
-
65
-
66
-
67
-
68
-
69
-
70
-
71
-
72
-
73
-
74
-
75
-
76
-
77
-
78
-
79
-
80
-
81
-
82
-
83
-
84
-
85
-
86
-
87
-
88
-
89
-
90
-
91
-
92
-
93
-
94
-
95
-
96
-
97
-
98
-
99
-
100
-
101
-
 102
102 -
 103
103 -
 104
104 -
 105
105 -
 106
106 -
 107
107 -
 108
108 -
 109
109 -
 110
110 -
 111
111 -
 112
112 -
 113
113 -
 114
114 -
 115
115 -
 116
116 -
 117
117 -
 118
118 -
 119
119 -
 120
120 -
 121
121 -
 122
122 -
123
 |
 |

GAMESTOP CORP.
NOTES TO CONSOLIDATED FINANCIAL STATEMENTS — (Continued)
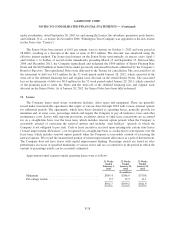
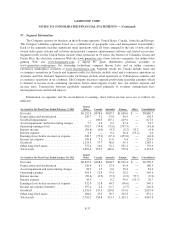
17. Segment Information
The Company operates its business in the following segments: United States, Canada, Australia and Europe.
The Company identifies segments based on a combination of geographic areas and management responsibility.
Each of the segments includes significant retail operations with all stores engaged in the sale of new and pre-
owned video game systems and software and personal computer entertainment software and related accessories.
Segment results for the United States include retail operations in 50 states, the District of Columbia, Guam and
Puerto Rico, the electronic commerce Web site www.gamestop.com, Game Informer magazine, the online video
gaming Web site www.kongregate.com, a digital PC game distribution platform available at
www.gamestop.com/pcgames, the streaming technology company Spawn Labs, and an online consumer
electronics marketplace available at www.buymytronics.com. Segment results for Canada include retail and
e-commerce operations in Canada and segment results for Australia include retail and e-commerce operations in
Australia and New Zealand. Segment results for Europe include retail operations in 13 European countries and
e-commerce operations in six countries. The Company measures segment profit using operating earnings, which
is defined as income from continuing operations before intercompany royalty fees, net interest expense and
income taxes. Transactions between reportable segments consist primarily of royalties, management fees,
intersegment loans and related interest.
Information on segments and the reconciliation to earnings (loss) before income taxes are as follows (in
millions):
As of and for the Fiscal Year Ended February 2, 2013
United
States Canada Australia Europe Other Consolidated
Net sales ............................... $6,192.4 $478.4 $607.3 $1,608.6 $ — $8,886.7
Depreciation and amortization .............. 120.7 5.1 13.8 36.9 — 176.5
Goodwill impairments ..................... — 100.3 107.1 419.6 — 627.0
Asset impairments and restructuring charges . . . 5.7 0.4 0.2 47.4 — 53.7
Operating earnings (loss) .................. 501.9 (74.4) (71.6) (397.5) — (41.6)
Interest income .......................... (50.6) (0.6) (4.7) (0.2) 55.2 (0.9)
Interest expense .......................... 2.8 — 0.2 56.4 (55.2) 4.2
Earnings (loss) before income tax expense ..... 549.7 (73.9) (67.1) (453.6) — (44.9)
Income tax expense ....................... 199.8 7.1 11.6 6.4 — 224.9
Goodwill ............................... 1,153.5 37.7 96.6 95.3 — 1,383.1
Other long-lived assets .................... 375.4 21.0 52.1 291.1 — 739.6
Total assets ............................. 2,665.4 252.2 416.6 799.4 — 4,133.6
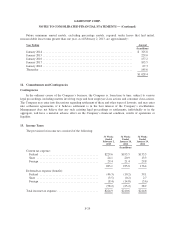
As of and for the Fiscal Year Ended January 28, 2012
United
States Canada Australia Europe Other Consolidated
Net sales ............................... $6,637.0 $498.4 $604.7 $1,810.4 $ — $9,550.5
Depreciation and amortization .............. 126.4 6.1 12.4 41.4 — 186.3
Asset impairment and restructuring charges .... 28.9 1.3 0.6 50.4 — 81.2
Operating earnings ....................... 501.9 12.4 35.4 20.2 — 569.9
Interest income .......................... (50.4) (0.3) (5.3) (0.2) 55.3 (0.9)
Interest expense .......................... 18.9 — 0.2 56.9 (55.3) 20.7
Earnings (loss) before income tax expense ..... 532.4 12.8 40.5 (36.6) — 549.1
Income tax expense (benefit) ............... 197.4 4.2 11.7 (2.7) — 210.6
Goodwill ............................... 1,152.0 137.4 210.0 519.6 — 2,019.0
Other long-lived assets .................... 404.0 23.0 58.3 345.8 — 831.1
Total assets ............................. 2,718.2 350.8 513.3 1,265.1 — 4,847.4
F-37