GameStop 2012 Annual Report Download - page 58
Download and view the complete annual report
Please find page 58 of the 2012 GameStop annual report below. You can navigate through the pages in the report by either clicking on the pages listed below, or by using the keyword search tool below to find specific information within the annual report.-
 1
1 -
2
-
3
-
4
-
5
-
6
-
7
-
8
-
9
-
10
-
11
-
12
-
13
-
14
-
15
-
16
-
17
-
18
-
19
-
20
-
21
-
22
-
23
-
24
-
25
-
26
-
27
-
28
-
29
-
30
-
31
-
32
-
33
-
34
-
35
-
36
-
37
-
38
-
39
-
40
-
41
-
42
-
43
-
44
-
45
-
46
-
47
-
 48
48 -
 49
49 -
 50
50 -
 51
51 -
 52
52 -
 53
53 -
 54
54 -
 55
55 -
 56
56 -
 57
57 -
 58
58 -
 59
59 -
 60
60 -
 61
61 -
 62
62 -
 63
63 -
 64
64 -
 65
65 -
 66
66 -
 67
67 -
 68
68 -
69
-
70
-
71
-
72
-
73
-
74
-
75
-
76
-
77
-
78
-
79
-
80
-
81
-
82
-
83
-
84
-
85
-
86
-
87
-
88
-
89
-
90
-
91
-
92
-
93
-
94
-
95
-
96
-
97
-
98
-
99
-
100
-
101
-
102
-
103
-
104
-
105
-
106
-
107
-
108
-
109
-
110
-
111
-
112
-
113
-
114
-
115
-
116
-
117
-
118
-
119
-
120
-
121
-
122
-
123
 |
 |

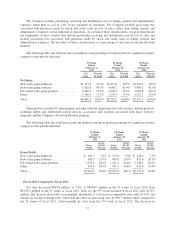
Fiscal 2012 Compared to Fiscal 2011
United States
Segment results for the United States include retail operations in 50 states, the District of Columbia, Puerto
Rico and Guam, the electronic commerce Web site www.gamestop.com, Game Informer magazine,
www.kongregate.com, a digital PC game distribution platform available at www.gamestop.com/pcgames, Spawn
Labs and an online consumer electronics marketplace available at www.buymytronics.com. As of February 2,
2013, the United States segment included 4,425 GameStop stores, compared to 4,503 stores on January 28, 2012.
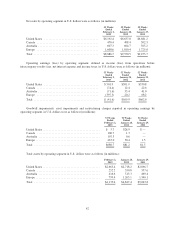
Net sales for fiscal 2012 decreased 6.7% compared to fiscal 2011 and comparable store sales decreased
8.7%. The decrease in comparable store sales was primarily due to decreases in new video game hardware sales,
new video game software sales and pre-owned video game products sales, offset partially by an increase in other
product sales and sales for the 53rd week in fiscal 2012. The decrease in new video game hardware sales was
primarily due to a decrease in hardware unit sell-through related to being in the late stages of the current console
cycle and sales from the launch of the Nintendo 3DS in the first quarter of fiscal 2011 which exceeded the sales
from the launch of the Sony PlayStation Vita in the first quarter of fiscal 2012, offset partially by the launch of
the Nintendo Wii U in the fourth quarter of fiscal 2012 and sales for the 53rd week in fiscal 2012. The decrease in
new video game software sales was primarily due to declines in demand due to the late stages of the console
cycle and a lack of new release video game titles in fiscal 2012 when compared to fiscal 2011, offset partially by
sales for the 53rd week in fiscal 2012. The decrease in pre-owned video game product sales was primarily due to
a decrease in store traffic related to the lack of new release video game titles in fiscal 2012 when compared to
fiscal 2011 and the late stages of the current console cycle, offset partially by sales for the 53rd week in fiscal
2012. The increase in other product sales was primarily due to an increase in sales of PC entertainment software
and mobile devices in fiscal 2012 when compared to fiscal 2011 and sales for the 53rd week in fiscal 2012.
Asset impairments of $5.7 million were recognized in fiscal 2012 primarily related to impairment of
definite-lived assets. Asset impairments and restructuring charges of $28.9 million were recognized in fiscal
2011 primarily related to asset impairments, severance and disposal costs associated with the exit of non-core
businesses. Segment operating income for both fiscal 2012 and fiscal 2011 was $501.9 million. Excluding the
impact of asset impairments and restructuring charges, adjusted segment operating income decreased
$23.2 million from $530.8 million in fiscal 2011 to $507.6 million in fiscal 2012 primarily related to the decrease
in comparable store sales between years.
Canada
Segment results for Canada include retail operations in Canada and an e-commerce site. As of February 2,
2013, the Canadian segment had 336 stores compared to 346 stores as of January 28, 2012. Net sales in the
Canadian segment in the 53 weeks ended February 2, 2013 decreased 4.0% compared to the 52 weeks ended
January 28, 2012. The decrease in net sales was primarily attributable to a decrease in sales at existing stores of
4.6%, partially offset by the favorable impact of changes in exchange rates of $1.6 million and additional sales in
the 53rd week of fiscal 2012 when compared to fiscal 2011. The decrease in net sales at existing stores was
primarily due to decreases in new video game hardware sales, new video game software sales and pre-owned
video game products sales, offset partially by an increase in other product sales. The decrease in new video game
hardware sales is primarily due to a decrease in hardware unit sell-through related to being in the late stages of
the current console cycle. The decrease in new video game software sales is primarily due to lower sales of new
release video game titles and the late stages of the console cycle. The decrease in pre-owned video game products
sales is due primarily to a decrease in store traffic related to lower sales of new release video game titles and the
late stages of the current console cycle. The increase in other product sales was primarily due to an increase in
PC entertainment software sales and sales of mobile devices.
The segment operating loss for fiscal 2012 was $74.4 million compared to operating earnings of
$12.4 million for fiscal 2011. The decrease in operating earnings was primarily due to the goodwill and asset
impairment charges of $100.7 million recognized during fiscal 2012 compared to $1.3 million in fiscal 2011.
43