GameStop 2012 Annual Report Download - page 6
Download and view the complete annual report
Please find page 6 of the 2012 GameStop annual report below. You can navigate through the pages in the report by either clicking on the pages listed below, or by using the keyword search tool below to find specific information within the annual report.-
 1
1 -
 2
2 -
 3
3 -
 4
4 -
 5
5 -
 6
6 -
 7
7 -
 8
8 -
 9
9 -
 10
10 -
 11
11 -
 12
12 -
 13
13 -
 14
14 -
 15
15 -
 16
16 -
 17
17 -
18
-
19
-
20
-
21
-
22
-
23
-
24
-
25
-
26
-
27
-
28
-
29
-
30
-
31
-
32
-
33
-
34
-
35
-
36
-
37
-
38
-
39
-
40
-
41
-
42
-
43
-
44
-
45
-
46
-
47
-
48
-
49
-
50
-
51
-
52
-
53
-
54
-
55
-
56
-
57
-
58
-
59
-
60
-
61
-
62
-
63
-
64
-
65
-
66
-
67
-
68
-
69
-
70
-
71
-
72
-
73
-
74
-
75
-
76
-
77
-
78
-
79
-
80
-
81
-
82
-
83
-
84
-
85
-
86
-
87
-
88
-
89
-
90
-
91
-
92
-
93
-
94
-
95
-
96
-
97
-
98
-
99
-
100
-
101
-
102
-
103
-
104
-
105
-
106
-
107
-
108
-
109
-
110
-
111
-
112
-
113
-
114
-
115
-
116
-
117
-
118
-
119
-
120
-
121
-
122
-
123
 |
 |

2012 ANNUAL REPORT POWER TO THE PLAYERS
BuySellTrade
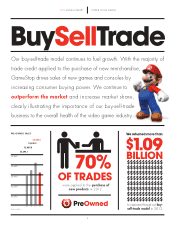
PRE-OWNED SALES
$2,000
$2,200
$2,400
$2,600
$2,800
$2,620.2
$2,430.5
$2,469.8
$2,394.1
09 10 11 12
Revenue in millions
were applied to the purchase of
new products in 2012.
to customers through our buy-
sell-trade model in 2012.
We returned more than
70%
OF TRADES
1. 0 9
BILLION
Our buy-sell-trade model continues to fuel growth. With the majority of
trade credit applied to the purchase of new merchandise,
GameStop drives sales of new games and consoles by
increasing consumer buying power. We continue to
outperform the market and increase market share,
clearly illustrating the importance of our buy-sell-trade
business to the overall health of the video game industry.
4