GameStop 2012 Annual Report Download - page 43
Download and view the complete annual report
Please find page 43 of the 2012 GameStop annual report below. You can navigate through the pages in the report by either clicking on the pages listed below, or by using the keyword search tool below to find specific information within the annual report.-
 1
1 -
2
-
3
-
4
-
5
-
6
-
7
-
8
-
9
-
10
-
11
-
12
-
13
-
14
-
15
-
16
-
17
-
18
-
19
-
20
-
21
-
22
-
23
-
24
-
25
-
26
-
27
-
28
-
29
-
30
-
31
-
32
-
 33
33 -
 34
34 -
 35
35 -
 36
36 -
 37
37 -
 38
38 -
 39
39 -
 40
40 -
 41
41 -
 42
42 -
 43
43 -
 44
44 -
 45
45 -
 46
46 -
 47
47 -
 48
48 -
 49
49 -
 50
50 -
 51
51 -
 52
52 -
 53
53 -
54
-
55
-
56
-
57
-
58
-
59
-
60
-
61
-
62
-
63
-
64
-
65
-
66
-
67
-
68
-
69
-
70
-
71
-
72
-
73
-
74
-
75
-
76
-
77
-
78
-
79
-
80
-
81
-
82
-
83
-
84
-
85
-
86
-
87
-
88
-
89
-
90
-
91
-
92
-
93
-
94
-
95
-
96
-
97
-
98
-
99
-
100
-
101
-
102
-
103
-
104
-
105
-
106
-
107
-
108
-
109
-
110
-
111
-
112
-
113
-
114
-
115
-
116
-
117
-
118
-
119
-
120
-
121
-
122
-
123
 |
 |
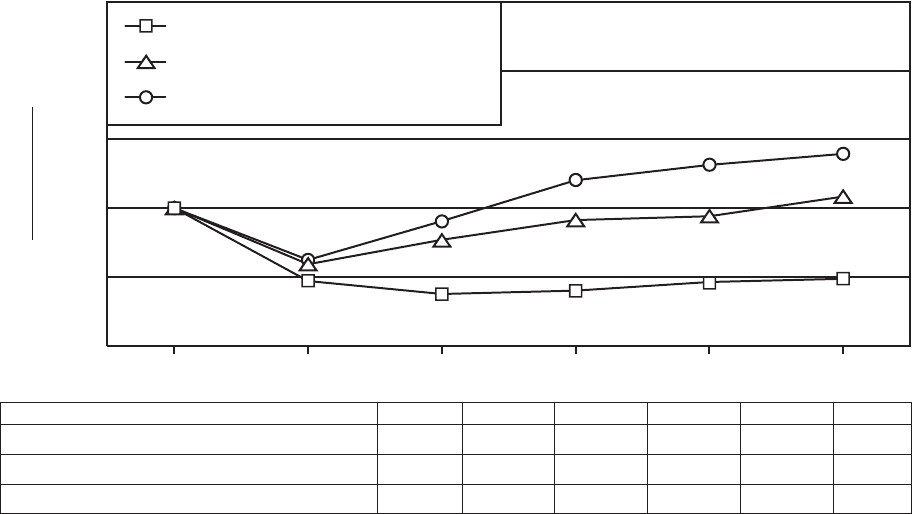
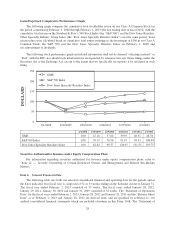
GameStop Stock Comparative Performance Graph
The following graph compares the cumulative total stockholder return on our Class A Common Stock for
the period commencing February 1, 2008 through February 1, 2013 (the last trading date of fiscal 2012) with the
cumulative total return on the Standard & Poor’s 500 Stock Index (the “S&P 500”) and the Dow Jones Retailers,
Other Specialty Industry Group Index (the “Dow Jones Specialty Retailers Index”) over the same period. Total
return values were calculated based on cumulative total return assuming (i) the investment of $100 in our Class A
Common Stock, the S&P 500 and the Dow Jones Specialty Retailers Index on February 1, 2008 and
(ii) reinvestment of dividends.
The following stock performance graph and related information shall not be deemed “soliciting material” or
“filed” with the SEC, nor should such information be incorporated by reference into any future filings under the
Securities Act or the Exchange Act, except to the extent that we specifically incorporate it by reference in such
filing.
2/1/20131/27/20121/28/20111/29/20101/30/20092/1/2008
DOLLARS
GME
S&P 500 Index
Dow Jones Specialty Retailers Index
0
50
100
150
200
250
2/1/2008 1/30/2009 1/29/2010 1/28/2011 1/27/2012 2/1/2013
GME 100 47.18 37.64 39.95 46.31 48.78
S&P 500 Index 100 59.19 76.96 91.47 94.33 108.44
Dow Jones Specialty Retailers Index 100 62.62 90.57 120.35 131.53 139.75
Securities Authorized for Issuance under Equity Compensation Plans
For information regarding securities authorized for issuance under equity compensation plans, refer to
“Item 12. — Security Ownership of Certain Beneficial Owners and Management and Related Stockholder
Matters.”
Item 6. Selected Financial Data
The following table sets forth our selected consolidated financial and operating data for the periods and at
the dates indicated. Our fiscal year is composed of 52 or 53 weeks ending on the Saturday closest to January 31.
The fiscal year ended February 2, 2013 consisted of 53 weeks. The fiscal years ended January 28, 2012,
January 29, 2011, January 30, 2010 and January 31, 2009 consisted of 52 weeks. The “Statement of Operations
Data” for the fiscal years ended February 2, 2013, January 28, 2012 and January 29, 2011 and the “Balance Sheet
Data” as of February 2, 2013 and January 28, 2012 are derived from, and are qualified by reference to, our
audited consolidated financial statements which are included elsewhere in this Form 10-K. The “Statement of
28