GameStop 2012 Annual Report Download - page 109
Download and view the complete annual report
Please find page 109 of the 2012 GameStop annual report below. You can navigate through the pages in the report by either clicking on the pages listed below, or by using the keyword search tool below to find specific information within the annual report.-
 1
1 -
2
-
3
-
4
-
5
-
6
-
7
-
8
-
9
-
10
-
11
-
12
-
13
-
14
-
15
-
16
-
17
-
18
-
19
-
20
-
21
-
22
-
23
-
24
-
25
-
26
-
27
-
28
-
29
-
30
-
31
-
32
-
33
-
34
-
35
-
36
-
37
-
38
-
39
-
40
-
41
-
42
-
43
-
44
-
45
-
46
-
47
-
48
-
49
-
50
-
51
-
52
-
53
-
54
-
55
-
56
-
57
-
58
-
59
-
60
-
61
-
62
-
63
-
64
-
65
-
66
-
67
-
68
-
69
-
70
-
71
-
72
-
73
-
74
-
75
-
76
-
77
-
78
-
79
-
80
-
81
-
82
-
83
-
84
-
85
-
86
-
87
-
88
-
89
-
90
-
91
-
92
-
93
-
94
-
95
-
96
-
97
-
98
-
 99
99 -
 100
100 -
 101
101 -
 102
102 -
 103
103 -
 104
104 -
 105
105 -
 106
106 -
 107
107 -
 108
108 -
 109
109 -
 110
110 -
 111
111 -
 112
112 -
 113
113 -
 114
114 -
 115
115 -
 116
116 -
 117
117 -
 118
118 -
 119
119 -
120
-
121
-
122
-
123
 |
 |

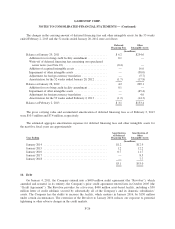
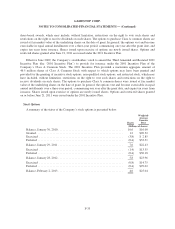
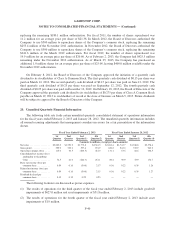
GAMESTOP CORP.
NOTES TO CONSOLIDATED FINANCIAL STATEMENTS — (Continued)
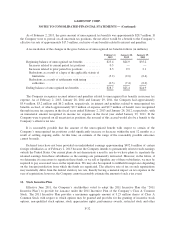
The following table summarizes information as of February 2, 2013 concerning outstanding and exercisable
options:
Options Outstanding Options Exercisable
Range of Exercise Prices
Number
Outstanding
(Millions)
Weighted-
Average
Remaining
Life (Years)
Weighted-
Average
Contractual
Price
Number
Exercisable
(Millions)
Weighted-
Average
Exercise
Price
$ 9.29 - $10.13 .......................... 1.0 1.86 $ 9.93 1.0 $ 9.93
$17.94 - $20.69 .......................... 1.5 4.64 $20.39 1.3 $20.40
$26.02 - $26.69 .......................... 1.3 5.33 $26.24 1.3 $26.24
$49.95 - $49.95 .......................... 0.8 5.01 $49.95 0.8 $49.95
$ 9.29 - $49.95 .......................... 4.6 4.32 $25.04 4.4 $25.26
The total intrinsic value of options exercised during the fiscal years ended February 2, 2013, January 28,
2012 and January 29, 2011 was $7.7 million, $16.0 million, and $59.9 million, respectively. The intrinsic value
of options exercisable and options outstanding was $19.8 million and $20.8 million, respectively, as of
February 2, 2013.
The fair value of each option is recognized as compensation expense on a straight-line basis between the
grant date and the date the options become fully vested. During the 53 weeks ended February 2, 2013 and the
52 weeks ended January 28, 2012 and January 29, 2011, the Company included compensation expense relating to
the grant of these options in the amount of $2.1 million, $6.4 million and $12.2 million, respectively, in selling,
general and administrative expenses. As of February 2, 2013, there was no unrecognized compensation expense
related to the unvested portion of the Company’s stock options.
Restricted Stock Awards
The Company grants restricted stock awards to certain of its employees, officers and non-employee
directors. Restricted stock awards generally vest over a three-year period on the anniversary of the date of
issuance.
F-34