GameStop 2012 Annual Report Download - page 54
Download and view the complete annual report
Please find page 54 of the 2012 GameStop annual report below. You can navigate through the pages in the report by either clicking on the pages listed below, or by using the keyword search tool below to find specific information within the annual report.-
 1
1 -
2
-
3
-
4
-
5
-
6
-
7
-
8
-
9
-
10
-
11
-
12
-
13
-
14
-
15
-
16
-
17
-
18
-
19
-
20
-
21
-
22
-
23
-
24
-
25
-
26
-
27
-
28
-
29
-
30
-
31
-
32
-
33
-
34
-
35
-
36
-
37
-
38
-
39
-
40
-
41
-
42
-
43
-
 44
44 -
 45
45 -
 46
46 -
 47
47 -
 48
48 -
 49
49 -
 50
50 -
 51
51 -
 52
52 -
 53
53 -
 54
54 -
 55
55 -
 56
56 -
 57
57 -
 58
58 -
 59
59 -
 60
60 -
 61
61 -
 62
62 -
 63
63 -
 64
64 -
65
-
66
-
67
-
68
-
69
-
70
-
71
-
72
-
73
-
74
-
75
-
76
-
77
-
78
-
79
-
80
-
81
-
82
-
83
-
84
-
85
-
86
-
87
-
88
-
89
-
90
-
91
-
92
-
93
-
94
-
95
-
96
-
97
-
98
-
99
-
100
-
101
-
102
-
103
-
104
-
105
-
106
-
107
-
108
-
109
-
110
-
111
-
112
-
113
-
114
-
115
-
116
-
117
-
118
-
119
-
120
-
121
-
122
-
123
 |
 |
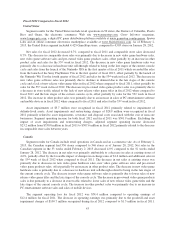
Depreciation and amortization expense decreased $9.8 million from $186.3 million in fiscal 2011 to
$176.5 million in fiscal 2012. This decrease was primarily due to a decrease in capital expenditures in recent
years when compared to prior years, which included significant investments in our loyalty and digital initiatives,
as well as a decrease in new store openings and investments in management information systems.
During fiscal 2012, the Company recorded a $680.7 million impairment charge, comprised of $627.0
million of goodwill impairments, $44.9 million of trade name impairment and $8.8 million of property and
equipment impairments. During fiscal 2011, the Company recorded asset impairments and restructuring charges
of $81.2 million. These charges were primarily due to impairment of the Company’s Micromania trade name in
France and impairment and disposal costs related to the exit of non-core businesses, including a small retail
movie chain of stores owned by the Company until fiscal 2011. Restructuring costs include disposal and exit
costs related to the exit of underperforming regions in Europe and consolidation of home office and back office
functions, as well as impairment and store closure costs primarily in the international segments. Refer to Note
9, Goodwill, Intangible Assets and Deferred Financing Fees, and Note 2, Asset Impairments and Restructuring
Charges, in Item 15 of this Annual Report on Form 10-K for further information associated with these
impairments.
Interest income resulting from the investment of excess cash balances was $0.9 million for fiscal 2011 and
fiscal 2012. Interest expense decreased from $20.7 million in fiscal 2011 to $4.2 million in fiscal 2012, primarily
due to the redemption of the remaining $250.0 million of the Company’s senior notes during fiscal 2011. Debt
extinguishment expense of $1.0 million was recognized in fiscal 2011 as a result of the write-off of deferred
financing fees and unamortized original issue discount associated with the redemption.
Income tax expense was $210.6 million, or 38.4% of earnings before income tax expense, in fiscal 2011
compared to $224.9 million in fiscal 2012. The difference in the effective income tax rate between fiscal 2012
and fiscal 2011 was primarily due to the recognition of the goodwill impairment charge in fiscal 2012 which is
not tax deductible and the recording of valuation allowances against certain deferred tax assets in the European
segment in fiscal 2012. Without the effect of the goodwill impairments, the asset impairments and the recording
of the valuation allowances, the effective income tax rate in fiscal 2012 would have been 36.6%. Refer to
Note 13, Income Taxes, in Item 15 of this Annual Report on Form 10-K for additional information regarding
income taxes.
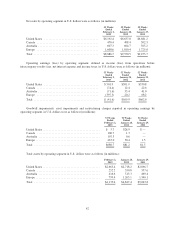
The factors described above led to a decrease in operating earnings of $611.5 million from $569.9 million of
operating earnings in fiscal 2011 to $41.6 million of operating loss in fiscal 2012 and a decrease in consolidated
net income of $608.3 million from $338.5 million of consolidated net income in fiscal 2011 to $269.8 million of
consolidated net loss in fiscal 2012. The decrease in operating earnings and consolidated net income is primarily
attributable to goodwill impairments recognized in fiscal 2012 offset partially by the decrease in asset
impairments and restructuring charges when compared to prior year. Excluding the impact of the goodwill and
other impairment charges of $680.7 million, operating earnings would have been $639.1 million and consolidated
net income would have been $403.0 million for fiscal 2012. Excluding the impact of asset impairments and
restructuring charges of $81.2 million, operating earnings would have been $651.1 million and consolidated net
income would have been $405.1 million for fiscal 2011.
The $0.1 million and $1.4 million net loss attributable to noncontrolling interests for fiscal 2012 and fiscal
2011, respectively, represent the portion of the minority interest stockholders’ net loss of the Company’s non-
wholly owned subsidiaries included in the Company’s consolidated results. The remaining noncontrolling
interests were purchased during the second quarter of fiscal 2012.
Fiscal 2011 Compared to Fiscal 2010
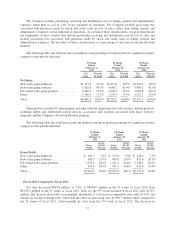
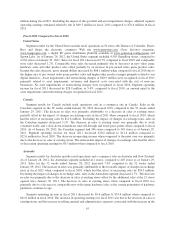
Net sales increased $76.8 million, or 0.8%, to $9,550.5 million in the 52 weeks of fiscal 2011 compared to
$9,473.7 million in the 52 weeks of fiscal 2010. The increase in net sales was primarily attributable to changes in
foreign exchange rates, which had the effect of increasing sales by $140.2 million when compared to the
39