Cisco 2006 Annual Report Download - page 78
Download and view the complete annual report
Please find page 78 of the 2006 Cisco annual report below. You can navigate through the pages in the report by either clicking on the pages listed below, or by using the keyword search tool below to find specific information within the annual report.-
 1
1 -
2
-
3
-
4
-
5
-
6
-
7
-
8
-
9
-
10
-
11
-
12
-
13
-
14
-
15
-
16
-
17
-
18
-
19
-
20
-
21
-
22
-
23
-
24
-
25
-
26
-
27
-
28
-
29
-
30
-
31
-
32
-
33
-
34
-
35
-
36
-
37
-
38
-
39
-
40
-
41
-
42
-
43
-
44
-
45
-
46
-
47
-
48
-
49
-
50
-
51
-
52
-
53
-
54
-
55
-
56
-
57
-
58
-
59
-
60
-
61
-
62
-
63
-
64
-
65
-
66
-
67
-
 68
68 -
 69
69 -
 70
70 -
 71
71 -
 72
72 -
 73
73 -
 74
74 -
 75
75 -
 76
76 -
 77
77 -
 78
78 -
 79
79
 |
 |

Corporate Information
This Annual Report contains forward-looking statements regarding future events and our future results that are subject to the safe harbors created under the Securities Act of 1933 and
the Securities Exchange Act of 1934. These statements are based on current expectations, estimates, forecasts, and projections about the industries in which we operate and the beliefs and
assumptions of our management. Words such as “expects,” “anticipates,” “targets,” “goals,” “projects,” “intends,” “plans,” “believes,” “seeks,” “estimates,” “continues,” “may,” variations of such words,
and similar expressions are intended to identify such forward-looking statements. In addition, statements that refer to: projections of our future financial performance, our business strategy, our
anticipated growth and trends in our businesses or key markets, including the commercial market segment; integration of our product architectures; future growth opportunities; investments
in resources, new advanced technologies, and emerging geographic markets; and other characterizations of future events or circumstances are forward-looking statements. Readers are
cautioned that these forward-looking statements are only predictions and may differ materially from actual future events or results due to a variety of factors, including: business and economic
conditions and growth trends in the networking industry and in various geographic regions; global economic conditions and uncertainties in the geopolitical environment; overall information
technology spending; the growth of the Internet and levels of capital spending on Internet-based systems; variations in customer demand for products and services, including sales to the
service provider market; the timing of orders and manufacturing and customer lead times; changes in customer order patterns or customer mix; insufficient, excess, or obsolete inventory;
variability of component costs; variations in sales channels, product costs, or mix of products sold; our ability to successfully acquire businesses and technologies and to successfully integrate
and operate these acquired businesses and technologies including the businesses and technologies of Scientific-Atlanta, Inc.; increased competition in the networking industry; dependence
on the introduction and market acceptance of new product offerings and standards; rapid technological and market change; manufacturing and sourcing risks, including risks relating to our
transition to a new manufacturing model; product defects and returns; litigation involving patents, intellectual property, antitrust, shareholder, and other matters; natural catastrophic events; a
pandemic or epidemic; achievement of the benefits anticipated from our investments in sales and engineering activities; our ability to recruit and retain key personnel; our ability to manage
financial risk; currency fluctuations and other international factors; potential volatility in operating results and other factors listed in Cisco’s most recent reports on Form 10-K, 10-Q, and 8-K. The
financial information contained in this Annual Report should be read in conjunction with the consolidated financial statements and notes thereto that are included in this report. Our results of
operations for the year ended July 29, 2006 are not necessarily indicative of our operating results for any future periods. We undertake no obligation to revise or update any forward-looking
statements for any reason.
Corporate Headquarters
San Jose, California, USA
European Headquarters
Amsterdam, Netherlands
Americas Headquarters
San Jose, California, USA
Asia Pacic Headquarters
Singapore
Cisco Systems has ofces in the following countries and regions. Addresses, phone numbers, and fax numbers are listed on the Cisco Website at
www.cisco.com/go/ofces.
Algeria • Argentina • Australia • Austria • Belgium • Brazil • Bulgaria • Canada • Chile • China • Colombia • Costa Rica • Croatia • Cyprus • Czech Republic
Denmark • Dominican Republic • Egypt • Estonia • Finland • France • Germany • Greece • Hong Kong • Hungary • Iceland • India • Indonesia • Ireland
Israel • Italy • Japan • Jordan • Kazakhstan • Kenya • Kuwait • Latvia • Lebanon • Lithuania • Luxembourg • Malaysia • Mexico • Morocco • Netherlands
New Zealand • Nigeria • Norway • Pakistan • Panama • Peru • Philippines • Poland • Portugal • Puerto Rico • Romania • Russia • Saudi Arabia • Serbia
and Montenegro • Singapore • Slovakia • Slovenia • South Africa • South Korea • Spain • Sri Lanka • Sweden • Switzerland • Taiwan • Thailand • Turkey
Ukraine • United Arab Emirates • United Kingdom • United States • Uzbekistan • Venezuela • Vietnam
Networks are an essential part of life’s experiences, helping to connect people in business, education, government, and the home.
Founded in 1984, Cisco has led in the innovation of Internet Protocol (IP)-based networking technologies. This tradition continues with
the development of routing and switching and numerous advanced technologies: application networking services, home networking,
hosted small-business systems, security, storage area networking, unied communications, video systems, and wireless.
Cisco and its valued partners sell Cisco hardware, software, and services to businesses of all sizes, governments, service providers,
and consumers.
An integral part of Cisco’s business strategy is strong corporate citizenship. Responsible business practices help ensure accountability,
business sustainability, and commitment to environmentally conscious operations and products. Social investments built upon partner-
ships with local organizations positively impact recipient communities around the world. As an expression of our company values and
beliefs, these activities are designed to build trust in our company and empower our employees.
Learn more at www.cisco.com.
© 2006 Cisco Systems, Inc. All rights reserved. Cisco, the Cisco logo, Catalyst, Cisco IOS, Cisco Systems, the Cisco Systems logo, IOS, Linksys, and Networking Academy are registered
trademarks or trademarks, and Changing the Way We Work, Live, Play, and Learn is a service mark of Cisco Systems, Inc. and/or its afliates in the United States and certain other countries.
All other trademarks mentioned in this document or Website are the property of their respective owners. The use of the word partner does not imply a partnership relationship between
Cisco and any other company. (0601R)
Worldwide Ofces
Company Prole
Forward-Looking Statements
Copyrights
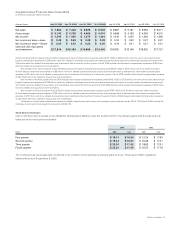
Financial Highlights
Net Sales
(Dollars in Billions)
‘02 ‘03 ‘04 ‘05 ‘06
22.0
Fiscal Year
Diluted Net Income
Per Share (in Dollars)
‘02 ‘03 ‘04 ‘05
0.50
‘06
0.62
Fiscal Year
0.25
18.9 18.9
28.5
0.89
24.8
0.87
Net Income(1)
(Dollars in Billions)
Cash and Cash Equivalents
and Investments
(Dollars in Billions)
20.7
19.3
21.5
1.9
3.6
4.4
‘02 ‘03 ‘04 ‘05 ‘06
Fiscal Year
‘02 ‘03 ‘04 ‘05 ‘06Fiscal Year
5.6
17.8
5.7
16.1
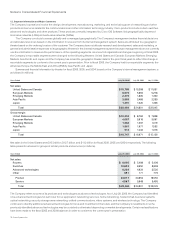
Consolidated Statements of Operations Data
(in millions, except per-share amounts)
Years Ended July 29, 2006 July 30, 2005 July 31, 2004
Total net sales $ 28,484 $ 24,801 $ 22,045
Income before provision for income taxes and cumulative effect of accounting change $ 7,633 $ 8,036 $ 6,992
Net income(1) $ 5,580 $ 5,741 $ 4,401
Net income per share—diluted $ 0.89 $ 0.87 $ 0.62
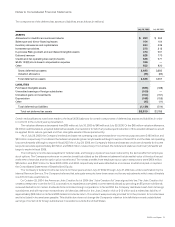
Consolidated Balance Sheets Data
(in millions)
July 29, 2006 July 30, 2005 July 31, 2004
Cash and cash equivalents and investments $ 17,814 $ 16,055 $ 19,267
Total assets $ 43,315 $ 33,883 $ 35,594
Shareholders’ equity $ 23,912 $ 23,174 $ 25,826
(1) Net income for scal 2006 included stock-based compensation expense under SFAS 123(R) of $836 million, net of tax. See note 1 on page 18.