Cisco 2006 Annual Report Download - page 25
Download and view the complete annual report
Please find page 25 of the 2006 Cisco annual report below. You can navigate through the pages in the report by either clicking on the pages listed below, or by using the keyword search tool below to find specific information within the annual report.-
 1
1 -
2
-
3
-
4
-
5
-
6
-
7
-
8
-
9
-
10
-
11
-
12
-
13
-
14
-
 15
15 -
 16
16 -
 17
17 -
 18
18 -
 19
19 -
 20
20 -
 21
21 -
 22
22 -
 23
23 -
 24
24 -
 25
25 -
 26
26 -
 27
27 -
 28
28 -
 29
29 -
 30
30 -
 31
31 -
 32
32 -
 33
33 -
 34
34 -
 35
35 -
36
-
37
-
38
-
39
-
40
-
41
-
42
-
43
-
44
-
45
-
46
-
47
-
48
-
49
-
50
-
51
-
52
-
53
-
54
-
55
-
56
-
57
-
58
-
59
-
60
-
61
-
62
-
63
-
64
-
65
-
66
-
67
-
68
-
69
-
70
-
71
-
72
-
73
-
74
-
75
-
76
-
77
-
78
-
79
 |
 |
28 Cisco Systems, Inc.
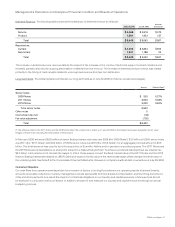
Net product sales may also be adversely affected by uctuations in demand for our products, especially with respect to Internet
businesses and telecommunications service providers, price and product competition in the communications and information technology
industry, introduction and market acceptance of new technologies and products, adoption of new networking standards, and nancial
difculties experienced by our customers. We may, from time to time, experience manufacturing issues that create a delay in our suppliers’
ability to provide specic components, resulting in delayed shipments. To the extent that manufacturing issues and any related component
shortages, including those caused by any possible disruption related to lean manufacturing, result in delayed shipments in the future, and
particularly in periods when we and our suppliers are operating at higher levels of capacity, it is possible that revenue for a quarter could be
adversely affected if such matters are not remediated within the same quarter. For additional factors that may impact net product sales, see
Part I, Item 1A. Risk Factors in our Annual Report on Form 10-K.
Our distributors and retail partners participate in various cooperative marketing and other programs. In addition, increasing sales to our
distributors and retail partners generally results in greater difculty in forecasting the mix of our products and, to a certain degree, the timing
of orders from our customers. We recognize revenue for sales to our distributors and retail partners based on a sell-through method using
information provided by them, and we maintain estimated accruals and allowances for all cooperative marketing and other programs.
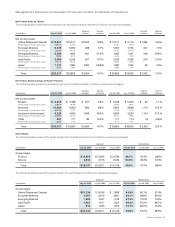
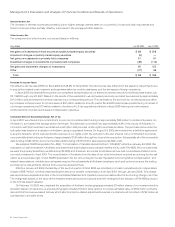
Net Service Revenue
The increase in net service revenue was primarily due to increased technical support service contract initiations and renewals associated
with higher product sales, which have resulted in a larger installed base of equipment being serviced, and revenue from advanced services,
which relates to consulting support services for our technologies for specic networking needs.
Gross Margin
The decrease in gross margin percentage compared to scal 2005 was primarily related to the acquisition of Scientic-Atlanta. Other factors
contributing to the decrease in gross margin percentage were the sales mix of certain switching and routing products, and the effect of
stock-based compensation expense under SFAS 123(R). These factors were partially offset by lower manufacturing costs related to lower
component costs and value engineering, and other manufacturing-related costs and higher volume. The gross margin for each theater is
based on information from the Company’s internal management system. The gross margin percentage for a particular theater may uctuate
and period to period changes in such margin percentages may not be indicative of a trend for that theater.
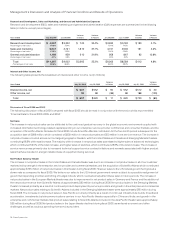
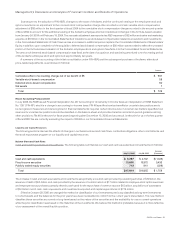
Product Gross Margin
Product gross margin for scal 2006 includes the effect of stock-based compensation expense related to employee stock options and
employee stock purchases under SFAS 123(R), amortization of purchased intangible assets, and inventory adjustments related to purchase
accounting, which collectively reduced product gross margin percentage by approximately 0.5%. The remaining decrease in product gross
margin percentage was due to the following factors. Changes in the mix of products sold decreased product gross margin percentage by
approximately 2.5%, with 1.5% of this decrease being related to the inclusion of net product sales from Scientic-Atlanta and the remainder
being due to sales of certain switching and routing products. Sales discounts, rebates, and product pricing decreased product gross margin
percentage by approximately 1%. Lower overall manufacturing costs related to lower component costs and value engineering and other
manufacturing-related costs increased product gross margin percentage by approximately 1%. Value engineering is the process by which
production costs are reduced through component redesign, board conguration, test processes, and transformation processes. Higher
shipment volume also increased product gross margin percentage by approximately 1.5%.
Product gross margin may continue to be adversely affected in the future by: changes in the mix of products sold, including further
periods of increased growth of some of our lower-margin products; introduction of new products, including products with price-performance
advantages; our ability to reduce production costs; entry into new markets, including markets with different pricing and cost structures;
changes in distribution channels; price competition, including competitors from Asia and especially China; changes in geographic mix;
sales discounts; increases in material or labor costs; excess inventory and obsolescence charges; warranty costs; changes in shipment
volume; loss of cost savings due to changes in component pricing; impact of value engineering; inventory holding charges; and how well
we execute on our strategy and operating plans.
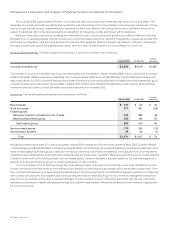
Service Gross Margin
Service gross margin for scal 2006 includes the effect of stock-based compensation expense related to employee stock options and
employee stock purchases under SFAS 123(R), which reduced service gross margin percentage by approximately 2.5% compared to
scal 2005. Our service gross margin beneted from higher revenue on a relatively stable cost base. Our service gross margin from
technical support services is higher than the service gross margin from our advanced services. Service gross margin will typically experience
some variability over time due to various factors such as the change in mix between technical support services and advanced services,
as well as the timing of technical support service contract initiations and renewals and the timing of our adding personnel and resources to
support this business. Our revenue from advanced services may continue to increase to a higher proportion of total service revenue due
to our continued focus on providing comprehensive support to our customers’ networking devices, applications, and infrastructures.
Management’s Discussion and Analysis of Financial Condition and Results of Operations