Cisco 2006 Annual Report Download - page 76
Download and view the complete annual report
Please find page 76 of the 2006 Cisco annual report below. You can navigate through the pages in the report by either clicking on the pages listed below, or by using the keyword search tool below to find specific information within the annual report.-
 1
1 -
2
-
3
-
4
-
5
-
6
-
7
-
8
-
9
-
10
-
11
-
12
-
13
-
14
-
15
-
16
-
17
-
18
-
19
-
20
-
21
-
22
-
23
-
24
-
25
-
26
-
27
-
28
-
29
-
30
-
31
-
32
-
33
-
34
-
35
-
36
-
37
-
38
-
39
-
40
-
41
-
42
-
43
-
44
-
45
-
46
-
47
-
48
-
49
-
50
-
51
-
52
-
53
-
54
-
55
-
56
-
57
-
58
-
59
-
60
-
61
-
62
-
63
-
64
-
65
-
 66
66 -
 67
67 -
 68
68 -
 69
69 -
 70
70 -
 71
71 -
 72
72 -
 73
73 -
 74
74 -
 75
75 -
 76
76 -
 77
77 -
 78
78 -
 79
79
 |
 |
2006 Annual Report 79
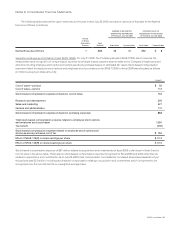
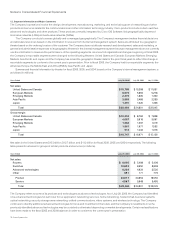
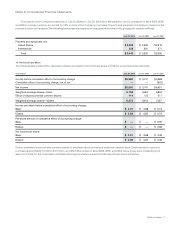
Quarters Ended July 29, 2006 Apr. 29, 2006 Jan. 28, 2006 Oct. 29,2005 July 30, 2005 Apr. 30, 2005 Jan. 29, 2005 Oct. 30, 2004
Net sales $ 7,984 $ 7,322 $ 6,628 $ 6,550 $ 6,581 $ 6,187 $ 6,062 $ 5,971
Gross margin $ 5,145 $ 4,726 $ 4,466 $ 4,410 $ 4,468 $ 4,135 $ 4,053 $ 4,015
Net income(1) $ 1,544 $ 1,400 $ 1,375 $ 1,261 $ 1,540 $ 1,405 $ 1,400 $ 1,396
Net income per share—basic $ 0.25 $ 0.23 $ 0.22 $ 0.20 $ 0.24 $ 0.22 $ 0.21 $ 0.21
Net income per share—diluted $ 0.25 $ 0.22 $ 0.22 $ 0.20 $ 0.24 $ 0.21 $ 0.21 $ 0.21
Cash and cash equivalents
and investments $ 17,814 $ 18,183 $ 14,989 $ 13,490 $ 16,055 $ 16,149 $ 16,525 $ 17,727
(1) Net income for the rst quarter of scal 2006 included stock-based compensation expense under SFAS 123(R) of $253 million, net of tax, which consisted of stock-
based compensation expense of $228 million, net of tax, related to employee stock options and employee stock purchases and stock-based compensation expense of
$25 million, net of tax, related to acquisitions and investments. Net income for the rst quarter of scal 2005 included stock-based compensation expense of $38 million,
net of tax, related to acquisitions and investments.
Net income for the second quarter of scal 2006 included stock-based compensation expense under SFAS 123(R) of $210 million, net of tax, which consisted
of stock-based compensation expense of $188 million, net of tax, related to employee stock options and employee stock purchases and stock-based compensation
expense of $22 million, net of tax, related to acquisitions and investments. Net income for the second quarter of scal 2005 included stock-based compensation expense
of $34 million, net of tax, related to acquisitions and investments.
Net income for the third quarter of scal 2006 included stock-based compensation expense under SFAS 123(R) of $209 million, net of tax, which consisted of stock-
based compensation expense of $188 million, net of tax, related to employee stock options and employee stock purchases and stock-based compensation expense of
$21 million, net of tax, related to acquisitions and investments. Net income for the third quarter of scal 2005 included stock-based compensation expense of $43 million,
net of tax, related to acquisitions and investments.
Net income for the fourth quarter of scal 2006 included stock-based compensation expense under SFAS 123(R) of $164 million, net of tax, which consisted
of stock-based compensation expense of $152 million, net of tax, related to employee stock options and employee stock purchases and stock-based compensation
expense of $12 million, net of tax, related to acquisitions and investments. Net income for the fourth quarter of scal 2005 included stock-based compensation expense
of $34 million, net of tax, related to acquisitions and investments.
There was no stock-based compensation expense related to employee stock options and employee stock purchases under SFAS 123 in scal 2005 because the
Company did not adopt the recognition provisions of SFAS 123.
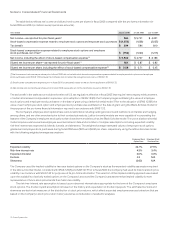
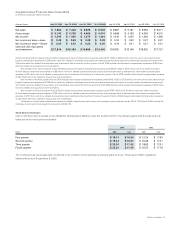
Stock Market Information
Cisco common stock is traded on the NASDAQ Global Select Market under the symbol CSCO. The following table lists the high and low
sales prices for each period indicated:
2006 2005
Fiscal High Low High Low
First quarter $ 19.74 $ 16.83 $ 21.24 $ 17.53
Second quarter $ 19.43 $ 16.87 $ 20.35 $ 17.41
Third quarter $ 22.00 $ 17.82 $ 18.80 $ 17.01
Fourth quarter $ 22.00 $ 17.45 $ 20.25 $ 17.16
The Company has never paid cash dividends on its common stock and has no present plans to do so. There were 77,991 registered
shareholders as of September 8, 2006.
Supplementary Financial Data (Unaudited)
(in millions, except per-share amounts)