Cisco 2006 Annual Report Download - page 65
Download and view the complete annual report
Please find page 65 of the 2006 Cisco annual report below. You can navigate through the pages in the report by either clicking on the pages listed below, or by using the keyword search tool below to find specific information within the annual report.-
 1
1 -
2
-
3
-
4
-
5
-
6
-
7
-
8
-
9
-
10
-
11
-
12
-
13
-
14
-
15
-
16
-
17
-
18
-
19
-
20
-
21
-
22
-
23
-
24
-
25
-
26
-
27
-
28
-
29
-
30
-
31
-
32
-
33
-
34
-
35
-
36
-
37
-
38
-
39
-
40
-
41
-
42
-
43
-
44
-
45
-
46
-
47
-
48
-
49
-
50
-
51
-
52
-
53
-
54
-
 55
55 -
 56
56 -
 57
57 -
 58
58 -
 59
59 -
 60
60 -
 61
61 -
 62
62 -
 63
63 -
 64
64 -
 65
65 -
 66
66 -
 67
67 -
 68
68 -
 69
69 -
 70
70 -
 71
71 -
 72
72 -
 73
73 -
 74
74 -
 75
75 -
76
-
77
-
78
-
79
 |
 |
68 Cisco Systems, Inc.
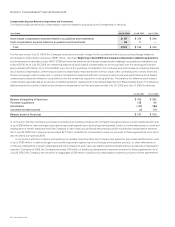
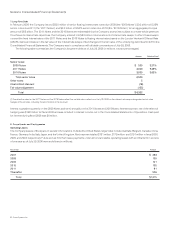
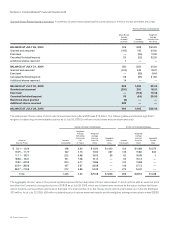
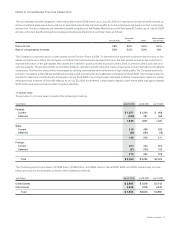
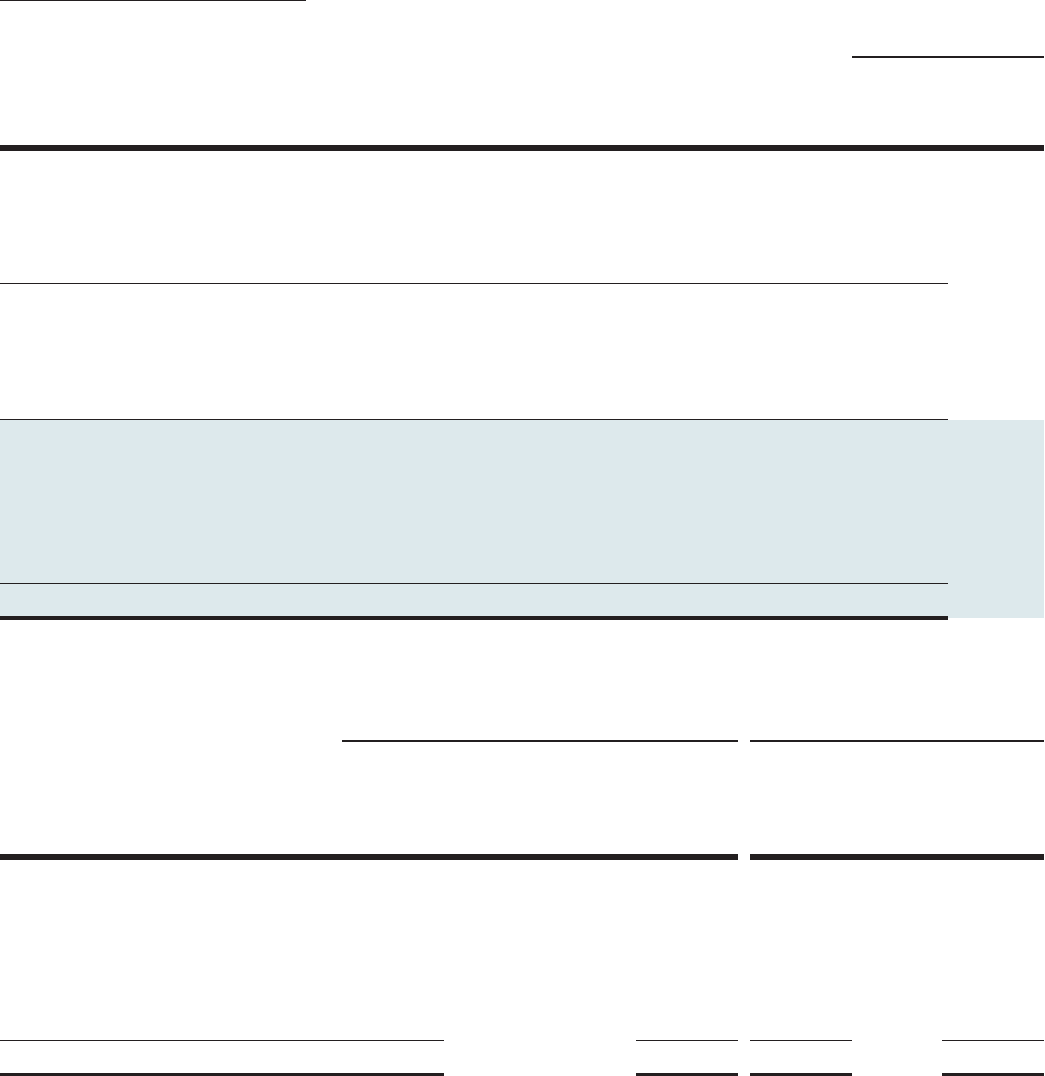
General Share-Based Award Information A summary of share-based award activity is as follows (in millions, except per-share amounts):
STOCK OPTIONS OUTSTANDING
Share-Based
Awards
Available
for Grant
Number
Outstanding
Weighted-
Average
Exercise Price
Per Share
BALANCE AT JULY 26, 2003 526 1,303 $ 25.29
Granted and assumed (195) 195 20.00
Exercised — (96) 10.03
Canceled/forfeited/expired 52 (52) 32.33
Additional shares reserved 7 — —
BALANCE AT JULY 31, 2004 390 1,350 25.34
Granted and assumed (244) 244 18.70
Exercised — (93) 8.44
Canceled/forfeited/expired 63 (65) 31.63
Additional shares reserved 14 — —
BALANCE AT JULY 30, 2005 223 1,436 25.02
Granted and assumed (230) 230 18.21
Exercised — (136) 10.08
Canceled/forfeited/expired 79 (84) 29.53
Restricted stock granted (6) — —
Additional shares reserved 398 — —
BALANCE AT JULY 29, 2006 464 1,446 $ 25.08
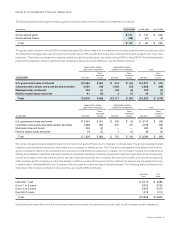
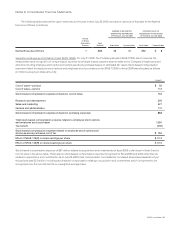
The total pretax intrinsic value of stock options exercised during scal 2006 was $1.3 billion. The following table summarizes signicant
ranges of outstanding and exercisable options as of July 29, 2006 (in millions, except years and per-share amounts):
STOCK OPTIONS OUTSTANDING STOCK OPTIONS EXERCISABLE
Number
Outstanding
Weighted-
Average
Remaining
Contractual
Life
(in Years)
Weighted-
Average
Exercise
Price Per
Share
Aggregate
Intrinsic
Value
Number
Exercisable
Weighted-
Average
Exercise
Price Per
Share
Aggregate
Intrinsic
Value
$ 0.01 – 13.04 198 3.90 $ 10.92 $ 1,420 152 $ 10.89 $ 1,072
13.05 – 17.70 182 4.73 15.90 397 146 15.80 334
17.71 – 18.57 222 6.98 18.05 36 62 18.48 2
18.58 – 19.31 181 7.08 19.14 — 64 19.13 —
19.32 – 20.53 204 5.77 19.86 — 124 19.98 —
20.54 – 38.06 187 3.67 26.08 — 149 27.13 —
38.07 – 72.56 272 2.89 54.39 — 272 54.40 —
Total 1,446 4.92 $ 25.08 $ 1,853 969 $ 28.53 $ 1,408
The aggregate intrinsic value in the preceding table represents the total pretax intrinsic value based on stock options with an exercise price
less than the Company’s closing stock price of $18.08 as of July 29, 2006, which would have been received by the option holders had those
option holders exercised their options as of that date. The total number of in-the-money stock options exercisable as of July 29, 2006 was
303 million. As of July 30, 2005, 906 million outstanding stock options were exercisable and the weighted-average exercise price was $28.80.
Notes to Consolidated Financial Statements
Range of
Exercise Prices