Cisco 2006 Annual Report Download - page 26
Download and view the complete annual report
Please find page 26 of the 2006 Cisco annual report below. You can navigate through the pages in the report by either clicking on the pages listed below, or by using the keyword search tool below to find specific information within the annual report.-
 1
1 -
2
-
3
-
4
-
5
-
6
-
7
-
8
-
9
-
10
-
11
-
12
-
13
-
14
-
15
-
 16
16 -
 17
17 -
 18
18 -
 19
19 -
 20
20 -
 21
21 -
 22
22 -
 23
23 -
 24
24 -
 25
25 -
 26
26 -
 27
27 -
 28
28 -
 29
29 -
 30
30 -
 31
31 -
 32
32 -
 33
33 -
 34
34 -
 35
35 -
 36
36 -
37
-
38
-
39
-
40
-
41
-
42
-
43
-
44
-
45
-
46
-
47
-
48
-
49
-
50
-
51
-
52
-
53
-
54
-
55
-
56
-
57
-
58
-
59
-
60
-
61
-
62
-
63
-
64
-
65
-
66
-
67
-
68
-
69
-
70
-
71
-
72
-
73
-
74
-
75
-
76
-
77
-
78
-
79
 |
 |

2006 Annual Report 29
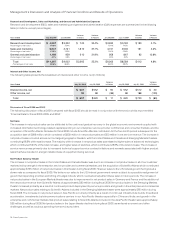
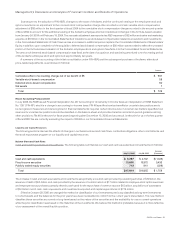
Research and Development, Sales and Marketing, and General and Administrative Expenses
R&D expenses increased for scal 2006 compared to scal 2005 primarily due to higher headcount-related expenses reecting our
continued investment in R&D efforts in routers, switches, advanced technologies, and other product technologies; the effect of stock-based
compensation expense related to employee stock options and employee stock purchases under SFAS 123(R); and the acquisition of
Scientic-Atlanta. R&D expenses include $346 million of stock-based compensation expense related to employee stock options and
employee stock purchases under SFAS 123(R), and Scientic-Atlanta contributed $90 million of additional R&D expenses. We have also
continued to purchase or license technology in order to bring a broad range of products to market in a timely fashion. If we believe that we are
unable to enter a particular market in a timely manner with internally developed products, we may license technology from other businesses
or acquire businesses as an alternative to internal R&D. All of our R&D costs have been expensed as incurred.
Sales and marketing expenses for scal 2006 increased compared to scal 2005 primarily due to an increase in sales expenses of
approximately $1.1 billion. Sales expenses increased primarily due to an increase in headcount-related expenses, an increase in sales
program expenses, and the acquisition of Scientic-Atlanta, which added approximately $30 million of sales expenses. Sales expenses
also include stock-based compensation expense related to employee stock options and employee stock purchases under SFAS 123(R) of
$337 million during scal 2006. Marketing expenses include $90 million of stock-based compensation expense related to employee stock
options and employee stock purchases under SFAS 123(R) during scal 2006. Scientic-Atlanta added approximately $20 million of
marketing expenses.
G&A expenses for scal 2006 increased compared to scal 2005 primarily because of stock-based compensation expense related to
employee stock options and employee stock purchases under SFAS 123(R), and the acquisition of Scientic-Atlanta. G&A expenses include
$115 million of stock-based compensation expense related to employee stock options and employee stock purchases under SFAS 123(R)
and Scientic-Atlanta contributed approximately $40 million of G&A expenses.
Our headcount increased by approximately 11,500 employees in scal 2006. Approximately 8,000 of the new employees were attributable
to acquisitions we completed in scal 2006. Our headcount is expected to increase, as we continue to focus on the commercial market
segment; additional sales coverage; growing and expanding our advanced technologies; our evolving support model; expanding our
presence in the Emerging Markets theater; the next-generation service provider network build-outs; strengthening our product offerings in
the consumer market; and providing more comprehensive solutions to our customers as they employ Internet solutions. As a result, if we do
not achieve the benets anticipated from these investments, our operating results may be adversely affected.
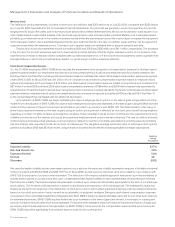
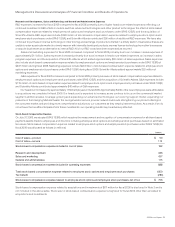
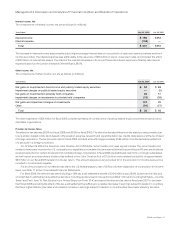
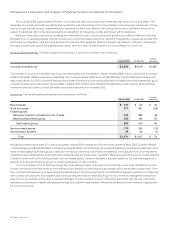
Stock-Based Compensation Expense
On July 31, 2005, we adopted SFAS 123(R), which requires the measurement and recognition of compensation expense for all share-based
payment awards made to employees and directors including employee stock options and employee stock purchases based on estimated
fair values. Stock-based compensation expense related to employee stock options and employee stock purchases under SFAS 123(R) for
scal 2006 was allocated as follows (in millions):
Amount
Cost of sales—product $ 50
Cost of sales—service 112
Stock-based compensation expense included in cost of sales 162
Research and development 346
Sales and marketing 427
General and administrative 115
Stock-based compensation expense included in operating expenses 888
Total stock-based compensation expense related to employee stock options and employee stock purchases 1,050
Tax benefit (294)
Stock-based compensation expense related to employee stock options and employee stock purchases, net of tax $ 756
Stock-based compensation expense related to acquisitions and investments of $87 million for scal 2006 is disclosed in Note 3 and is
not included in the above table. There was no stock-based compensation expense recognized for scal 2005 other than as related to
acquisitions and investments.
Management’s Discussion and Analysis of Financial Condition and Results of Operations