Cisco 2006 Annual Report Download - page 53
Download and view the complete annual report
Please find page 53 of the 2006 Cisco annual report below. You can navigate through the pages in the report by either clicking on the pages listed below, or by using the keyword search tool below to find specific information within the annual report.-
 1
1 -
2
-
3
-
4
-
5
-
6
-
7
-
8
-
9
-
10
-
11
-
12
-
13
-
14
-
15
-
16
-
17
-
18
-
19
-
20
-
21
-
22
-
23
-
24
-
25
-
26
-
27
-
28
-
29
-
30
-
31
-
32
-
33
-
34
-
35
-
36
-
37
-
38
-
39
-
40
-
41
-
42
-
 43
43 -
 44
44 -
 45
45 -
 46
46 -
 47
47 -
 48
48 -
 49
49 -
 50
50 -
 51
51 -
 52
52 -
 53
53 -
 54
54 -
 55
55 -
 56
56 -
 57
57 -
 58
58 -
 59
59 -
 60
60 -
 61
61 -
 62
62 -
 63
63 -
64
-
65
-
66
-
67
-
68
-
69
-
70
-
71
-
72
-
73
-
74
-
75
-
76
-
77
-
78
-
79
 |
 |
56 Cisco Systems, Inc.
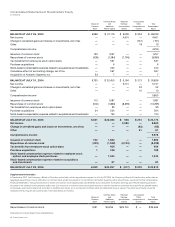
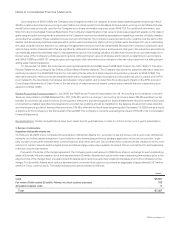
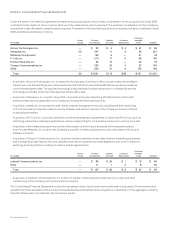
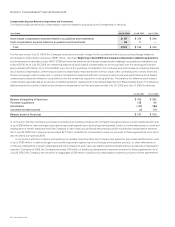
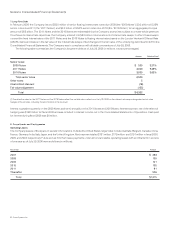
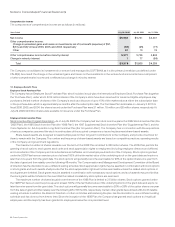
The following table presents details of the amortization expense of purchased intangible assets as reported in the Consolidated Statements
of Operations (in millions):
Years Ended July 29, 2006 July 30, 2005 July 31, 2004
Reported as:
Cost of sales $ 60 $ — $ 13
Operating expenses 393 227 242
Total $ 453 $ 227 $ 255
During the year ended July 29, 2006, the Company recorded an impairment charge of $69 million from a write down of purchased intangible
assets related to certain technology and customer relationships due to a reduction in expected future cash ows and the amount was recorded
as amortization of purchased intangible assets in the Consolidated Statements of Operations.
The estimated future amortization expense of purchased intangible assets as of July 29, 2006, is as follows (in millions):
Fiscal Year Amount
2007 $ 525
2008 466
2009 382
2010 274
2011 209
Thereafter 305
Total $ 2,161
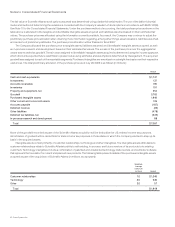
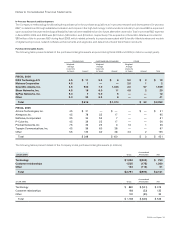
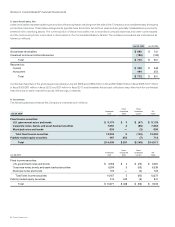
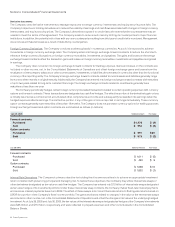
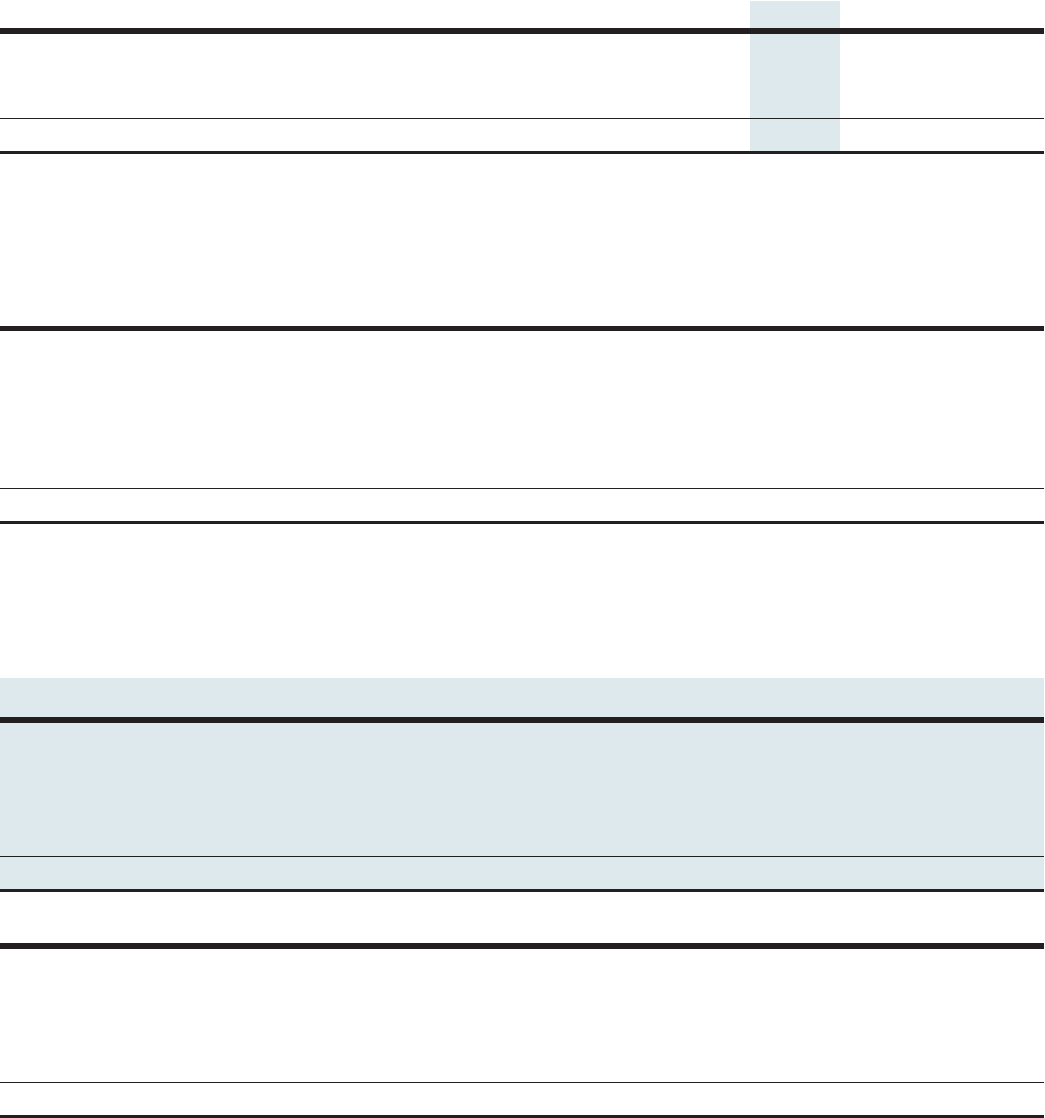
Goodwill
Beginning in scal 2006, the Company’s reportable segments were changed to the following theaters: United States and Canada; European
Markets; Emerging Markets; Asia Pacic; and Japan. As a result, the Company reallocated goodwill to these reportable segments. The
following tables present the changes in goodwill allocated to the Company’s reportable segments during scal 2006 and 2005 (in millions):
Balance at
July 30, 2005
Scientific-Atlanta
Acquisition
Other
Acquisitions Other
Balance at
July 29, 2006Fiscal 2006
United States and Canada $ 3,304 $ 3,396 $ 120 $ (42) $ 6,778
European Markets 744 338 28 17 1,127
Emerging Markets 253 28 11 — 292
Asia Pacific 266 — 11 — 277
Japan 728 — 25 — 753
Total $ 5,295 $ 3,762 $ 195 $ (25) $ 9,227
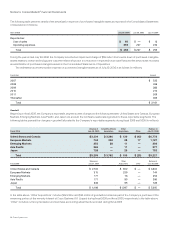
Fiscal 2005
Balance at
July 31, 2004
Other
Acquisitions Other
Balance at
July 30, 2005
United States and Canada $ 2,702 $ 602 $ — $ 3,304
European Markets 515 229 — 744
Emerging Markets 177 76 — 253
Asia Pacific 171 95 — 266
Japan 633 95 — 728
Total $ 4,198 $ 1,097 $ — $ 5,295
In the table above, “Other Acquisitions” includes $22 million and $30 million of goodwill recorded as part of the Company’s purchase of the
remaining portion of the minority interest of Cisco Systems, K.K. (Japan) during scal 2006 and scal 2005, respectively. In the table above,
“Other” includes currency translation and purchase accounting adjustments recorded during scal 2006.
Notes to Consolidated Financial Statements