Cisco 2006 Annual Report Download - page 29
Download and view the complete annual report
Please find page 29 of the 2006 Cisco annual report below. You can navigate through the pages in the report by either clicking on the pages listed below, or by using the keyword search tool below to find specific information within the annual report.-
 1
1 -
2
-
3
-
4
-
5
-
6
-
7
-
8
-
9
-
10
-
11
-
12
-
13
-
14
-
15
-
16
-
17
-
18
-
 19
19 -
 20
20 -
 21
21 -
 22
22 -
 23
23 -
 24
24 -
 25
25 -
 26
26 -
 27
27 -
 28
28 -
 29
29 -
 30
30 -
 31
31 -
 32
32 -
 33
33 -
 34
34 -
 35
35 -
 36
36 -
 37
37 -
 38
38 -
 39
39 -
40
-
41
-
42
-
43
-
44
-
45
-
46
-
47
-
48
-
49
-
50
-
51
-
52
-
53
-
54
-
55
-
56
-
57
-
58
-
59
-
60
-
61
-
62
-
63
-
64
-
65
-
66
-
67
-
68
-
69
-
70
-
71
-
72
-
73
-
74
-
75
-
76
-
77
-
78
-
79
 |
 |

32 Cisco Systems, Inc.
Discussion of Fiscal 2005 and 2004
The following discussion of scal 2005 compared with scal 2004 should be read in conjunction with the section of this report entitled
“Financial Data for Fiscal 2006, 2005, and 2004.”
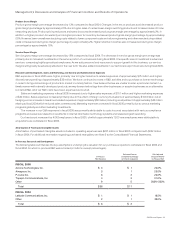
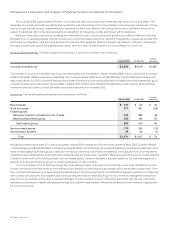
Net Sales
The increase in net product sales for scal 2005 compared to scal 2004 was attributed to the continued gradual recovery in the global
economic environment coupled with increased information technology-related capital spending in our enterprise, service provider,
commercial, and consumer markets. The increase in net product sales occurred across all geographic theaters, with the United States and
Canada and European Markets theaters contributing 75.6% of the total increase. The majority of the increase in net product sales was related
to higher sales of switches, which contributed 48.3% of the total increase, and higher sales of advanced technology products, which
contributed 47.9% of the total increase. The increase in service revenue was primarily due to increased technical support service contract
initiations and renewals associated with higher product sales that have resulted in a larger installed base of equipment being serviced.
Fiscal 2005 had 52 weeks compared with 53 weeks in scal 2004, and we believe that this extra week may have had a positive impact
on our sales in scal 2004. However, we were not able to quantify the effect of the slightly longer year on our revenue.
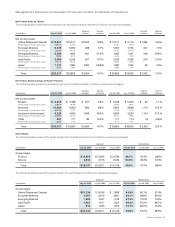
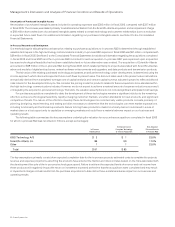
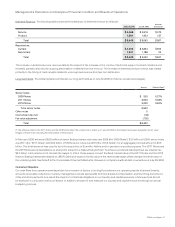
Net Product Sales by Theater
The increase in net product sales in the United States and Canada theater in scal 2005 was due to an increase in net product sales to
all of our customer markets in the United States. However, our sales to the U.S. federal government, included within our enterprise market,
experienced weakness due to, we believe, a realignment of spending priorities. Net product sales in the European Markets and Emerging
Markets theaters increased primarily as a result of continued product deployment by service providers and growth in enterprise markets.
Net product sales in the United Kingdom represented the largest increase in the European Markets theater. In Asia Pacic, net product sales
increased primarily as a result of infrastructure builds, broadband acceleration, and investments by Asian telecommunications carriers. The
growth was primarily in the service provider and enterprise markets in India, Korea, and Australia. However, we experienced weakness in
our product sales to China. Net product sales in the Japan theater reected ongoing economic and other challenges in the theater during
scal 2005.
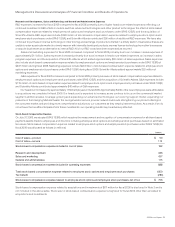
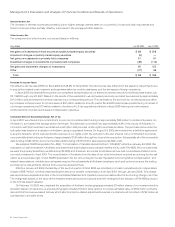
Net Product Sales by Groups of Similar Products
Routers The increase in net product sales related to routers in scal 2005 was primarily due to sales of high-end routers. Our sales of
high-end routers, which represent a larger proportion of our total router sales compared with midrange and low-end routers, increased by
$122 million over scal 2004. Sales of our midrange and low-end routers decreased by $30 million. In scal 2005, we introduced the integrated
services router. Sales of integrated services routers represented approximately 20% of our total revenue from midrange and low-end
routers in scal 2005. For the fourth quarter of scal 2005, sales of integrated services routers represented approximately 35% of our total
revenue from midrange and low-end routers. Our high-end router sales are primarily to service providers, which tend to make large and
sporadic purchases. In addition, our router sales in scal 2005 may have been impacted by new product introductions and increased
competition from price-focused competitors.
Switches The increase in net product sales related to switches in scal 2005 was due to sales of LAN xed switches and LAN modular switches.
Our sales of LAN xed and modular switches increased by approximately $1.2 billion, compared with scal 2004. The increase in sales of
LAN switches was a result of the continued adoption of new technologies by our customers, resulting in higher sales of our high-end modular
switch, the Cisco Catalyst 6500 Series, and xed switches, including the Cisco Catalyst 3750 Series and Catalyst 3560 Series.
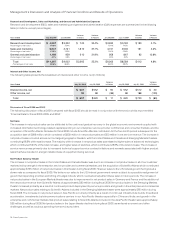
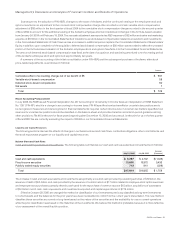
Advanced Technologies We experienced higher sales in scal 2005 in all of our advanced technologies compared with scal 2004. Home
networking product sales increased by approximately $250 million, and were related to the growth of our wireless and wired router
businesses. Unied communications sales increased by approximately $220 million primarily due to sales of IP phones and associated
software as our customers transitioned from an analog-based to an IP-based infrastructure. Sales of security products increased by
approximately $195 million primarily due to module and line card sales related to our routers and LAN modular switches as customers
continued to emphasize network security. Optical networking product sales increased by approximately $150 million due to sales of the
Cisco ONS 15454E and ONS 15454 platforms. Wireless LAN product sales increased by approximately $135 million. Sales of storage
area networking products increased by approximately $105 million. Wireless LAN and storage area networking product sales increased
primarily due to new customers and continued deployments with existing customers. Application networking services revenue increased by
approximately $43 million.
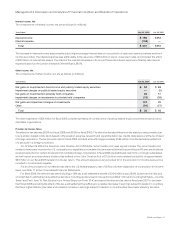
Net Service Revenue
The increase in net service revenue was primarily due to increased technical support service contract initiations and renewals associated
with higher product sales that have resulted in a larger installed base of equipment being serviced and revenue from advanced services,
which relates to consulting support services of our technologies for specic networking needs.
Management’s Discussion and Analysis of Financial Condition and Results of Operations