Cisco 2006 Annual Report Download - page 17
Download and view the complete annual report
Please find page 17 of the 2006 Cisco annual report below. You can navigate through the pages in the report by either clicking on the pages listed below, or by using the keyword search tool below to find specific information within the annual report.-
 1
1 -
2
-
3
-
4
-
5
-
6
-
 7
7 -
 8
8 -
 9
9 -
 10
10 -
 11
11 -
 12
12 -
 13
13 -
 14
14 -
 15
15 -
 16
16 -
 17
17 -
 18
18 -
 19
19 -
 20
20 -
 21
21 -
 22
22 -
 23
23 -
 24
24 -
 25
25 -
 26
26 -
 27
27 -
28
-
29
-
30
-
31
-
32
-
33
-
34
-
35
-
36
-
37
-
38
-
39
-
40
-
41
-
42
-
43
-
44
-
45
-
46
-
47
-
48
-
49
-
50
-
51
-
52
-
53
-
54
-
55
-
56
-
57
-
58
-
59
-
60
-
61
-
62
-
63
-
64
-
65
-
66
-
67
-
68
-
69
-
70
-
71
-
72
-
73
-
74
-
75
-
76
-
77
-
78
-
79
 |
 |

20 Cisco Systems, Inc.
During scal 2006, we generated cash ows from operations of $7.9 billion. Our cash and cash equivalents and investments were
$17.8 billion at the end of scal 2006, compared with $16.1 billion at the end of scal 2005. We raised $6.5 billion of cash in a debt offering
and used $5.0 billion for the Scientic-Atlanta acquisition, net of cash, cash equivalents, and investments acquired. We used $8.3 billion of
cash to repurchase 435 million shares of our common stock during scal 2006. Days sales outstanding in accounts receivable at the end of
scal 2006 were 38 days, compared with 31 days at the end of scal 2005. While our inventory balance was $1.4 billion at the end of scal
2006 compared to $1.3 billion at the end of scal 2005, our annualized inventory turns increased to 8.5 in the fourth quarter of scal 2006 as
compared with 6.6 in the fourth quarter of scal 2005. The inventory balances and turns for the fourth quarter of scal 2006 reected increased
sales, the initial implementation of the lean manufacturing model, and the addition of Scientic-Atlanta inventory.
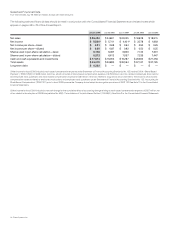
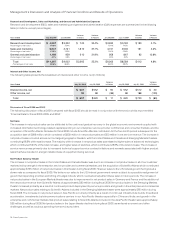
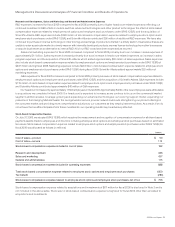
Beginning in scal 2006, we adopted SFAS 123(R) on a modied prospective basis. The following table provides a comparison of net
income, if the effect of pro forma stock-based compensation expense as disclosed in the notes to the Consolidated Financial Statements
were included for scal 2005 (in millions, except per-share amounts):
Years Ended July 29, 2006 July 30, 2005
Net income—as reported for fiscal 2005(1) N/A $ 5,741
Stock-based compensation expense related to employee stock options and employee stock purchases $ (1,050) (1,628)
Tax benefit $ 294 594
Stock-based compensation expense related to employee stock options and employee stock
purchases, net of tax(2) $ (756) (1,034)
Net income, including the effect of stock-based compensation expense(3) $ 5,580 $ 4,707
Diluted net income per share—as reported for fiscal 2005(1) N/A $ 0.87
Diluted net income per share, including the effect of stock-based compensation expense(3) $ 0.89 $ 0.71
(1) Net income and net income per share prior to scal 2006 did not include stock-based compensation expense related to employee stock options and employee
stock purchases under SFAS 123 because we did not adopt the recognition provisions of SFAS 123.
(2) Stock-based compensation expense prior to scal 2006 is calculated based on the pro forma application of SFAS 123 as previously disclosed in the notes to the
Consolidated Financial Statements.
(3) Net income and net income per share prior to scal 2006 represent pro forma information based on SFAS 123 as previously disclosed in the notes to the Consolidated
Financial Statements.
Critical Accounting Estimates
The preparation of nancial statements and related disclosures in conformity with accounting principles generally accepted in the United States
requires us to make judgments, assumptions, and estimates that affect the amounts reported in the Consolidated Financial Statements and
accompanying notes. Note 2 to the Consolidated Financial Statements describes the signicant accounting policies and methods used in
the preparation of the Consolidated Financial Statements. The accounting policies described below are signicantly affected by critical
accounting estimates. Such accounting policies require signicant judgments, assumptions, and estimates used in the preparation of the
Consolidated Financial Statements, and actual results could differ materially from the amounts reported based on these policies.
Revenue Recognition
Our products are generally integrated with software that is essential to the functionality of the equipment. Additionally, we provide unspecied
software upgrades and enhancements related to the equipment through our maintenance contracts, for most of our products. Accordingly,
we account for revenue in accordance with Statement of Position No. 97-2, “Software Revenue Recognition,” and all related interpretations.
For sales of products where software is incidental to the equipment, we apply the provisions of Staff Accounting Bulletin No. 101, “Revenue
Recognition in Financial Statements” and Staff Accounting Bulletin No. 104, “Revenue Recognition,” and all related interpretations. Revenue
is recognized when persuasive evidence of an arrangement exists, delivery has occurred, the fee is xed or determinable, and collectibility
is reasonably assured. In instances where nal acceptance of the product, system, or solution is specied by the customer, revenue is
deferred until all acceptance criteria have been met.
Management’s Discussion and Analysis of Financial Condition and Results of Operations