Cisco 2006 Annual Report Download - page 30
Download and view the complete annual report
Please find page 30 of the 2006 Cisco annual report below. You can navigate through the pages in the report by either clicking on the pages listed below, or by using the keyword search tool below to find specific information within the annual report.-
 1
1 -
2
-
3
-
4
-
5
-
6
-
7
-
8
-
9
-
10
-
11
-
12
-
13
-
14
-
15
-
16
-
17
-
18
-
19
-
 20
20 -
 21
21 -
 22
22 -
 23
23 -
 24
24 -
 25
25 -
 26
26 -
 27
27 -
 28
28 -
 29
29 -
 30
30 -
 31
31 -
 32
32 -
 33
33 -
 34
34 -
 35
35 -
 36
36 -
 37
37 -
 38
38 -
 39
39 -
 40
40 -
41
-
42
-
43
-
44
-
45
-
46
-
47
-
48
-
49
-
50
-
51
-
52
-
53
-
54
-
55
-
56
-
57
-
58
-
59
-
60
-
61
-
62
-
63
-
64
-
65
-
66
-
67
-
68
-
69
-
70
-
71
-
72
-
73
-
74
-
75
-
76
-
77
-
78
-
79
 |
 |

2006 Annual Report 33
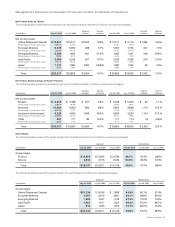
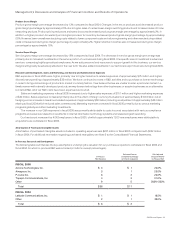
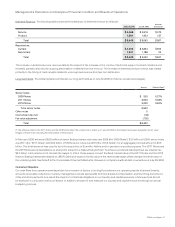
Product Gross Margin
Product gross margin percentage decreased by 1.3% compared to scal 2004. Changes in the mix of products sold decreased product
gross margin percentage by approximately 2.5% due to higher sales of certain lower-margin switching products and increased sales of home
networking products. Product pricing reductions and sales discounts decreased product gross margin percentage by approximately 2%. In
addition, a higher provision for warranty and a higher provision for inventory decreased product gross margin percentage by approximately
0.5%. However, lower overall manufacturing costs related to lower component costs and value engineering and other manufacturing-related
costs increased product gross margin percentage by approximately 2%. Higher shipment volumes also increased product gross margin
percentage by approximately 1.5%.
Service Gross Margin
Service gross margin percentage decreased by 1.8% compared to scal 2004. The decrease in service gross margin percentage was
primarily due to increased investments in the service portion of our business during scal 2005. One specic area of investment is advanced
services, comprising highly specialized employees. As we add personnel and resources to support growth in this business, our service
margins will typically be adversely affected in the near term. We also added investments in our technical support business during scal 2005.
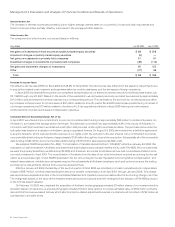
Research and Development, Sales and Marketing, and General and Administrative Expenses
R&D expenses in scal 2005 were higher primarily due to higher headcount-related expenses of approximately $75 million and higher
discretionary spending of approximately $35 million. We have continued to invest in R&D activities and to purchase or license technology
in order to bring a broad range of products to market in a timely fashion. If we believe that we are unable to enter a particular market in a
timely manner with internally developed products, we may license technology from other businesses or acquire businesses as an alternative
to internal R&D. All of our R&D costs have been expensed as incurred.
Sales and marketing expenses in scal 2005 increased due to higher sales expenses of $151 million and higher marketing expenses
of $40 million. Sales expenses increased primarily due to the effect of foreign currency uctuations of approximately $100 million, net of
hedging; and an increase in headcount-related expenses of approximately $60 million (including an adjustment of approximately $40 million
relating to scal 2004 which reduced sales commissions). Marketing expenses increased in scal 2005 primarily due to various marketing
programs globally and other marketing investments.
The increase in our G&A expenses in scal 2005 was primarily attributable to costs incurred associated with various compliance
programs and expenses related to investments in internal information technology systems and related program spending.
Our headcount increased by 4,042 employees in scal 2005, of which approximately 1,200 new employees were attributable to
acquisitions we completed in scal 2005.
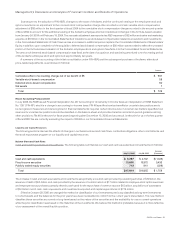
Amortization of Purchased Intangible Assets
Amortization of purchased intangible assets included in operating expenses was $227 million in scal 2005, compared with $242 million
in scal 2004. For additional information regarding purchased intangibles, see Note 3 to the Consolidated Financial Statements.
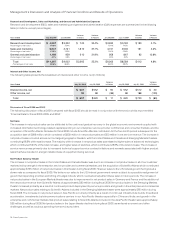
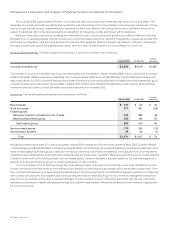
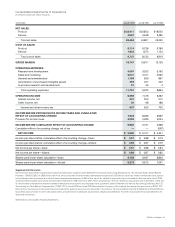
In-Process Research and Development
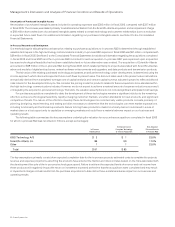
The following table summarizes the key assumptions underlying the valuation for our purchase acquisitions completed in scal 2005 and
scal 2004, for which in-process R&D was recorded (in millions, except percentages):
In-Process
R&D Expense
Estimated Cost to
Complete Technology
at Time of Acquisition
Risk-Adjusted
Discount Rate for
In-Process R&D
FISCAL 2005
Actona Technologies, Inc. $ 4 $ 1 24.0%
Airespace, Inc. 3 1 22.0%
P–Cube Inc. 6 2 24.0%
Topspin Communications, Inc. 4 2 21.0%
Other 9 5 20.0%–23.0%
Total $ 26 $ 11
FISCAL 2004
Latitude Communications, Inc. $ 1 $ 1 16.5%
Other 2 1 23.0%
Total $ 3 $ 2
Management’s Discussion and Analysis of Financial Condition and Results of Operations