Cisco 2006 Annual Report Download - page 37
Download and view the complete annual report
Please find page 37 of the 2006 Cisco annual report below. You can navigate through the pages in the report by either clicking on the pages listed below, or by using the keyword search tool below to find specific information within the annual report.-
 1
1 -
2
-
3
-
4
-
5
-
6
-
7
-
8
-
9
-
10
-
11
-
12
-
13
-
14
-
15
-
16
-
17
-
18
-
19
-
20
-
21
-
22
-
23
-
24
-
25
-
26
-
 27
27 -
 28
28 -
 29
29 -
 30
30 -
 31
31 -
 32
32 -
 33
33 -
 34
34 -
 35
35 -
 36
36 -
 37
37 -
 38
38 -
 39
39 -
 40
40 -
 41
41 -
 42
42 -
 43
43 -
 44
44 -
 45
45 -
 46
46 -
 47
47 -
48
-
49
-
50
-
51
-
52
-
53
-
54
-
55
-
56
-
57
-
58
-
59
-
60
-
61
-
62
-
63
-
64
-
65
-
66
-
67
-
68
-
69
-
70
-
71
-
72
-
73
-
74
-
75
-
76
-
77
-
78
-
79
 |
 |

40 Cisco Systems, Inc.
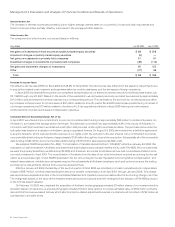
Investments
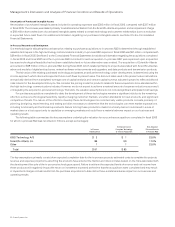
We maintain an investment portfolio of various holdings, types, and maturities. See Note 6 to the Consolidated Financial Statements. These
securities are classied as available-for-sale and consequently are recorded in the Consolidated Balance Sheets at fair value with unrealized
gains or losses, to the extent unhedged, reported as a separate component of accumulated other comprehensive income, net of tax.
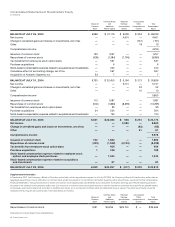
Fixed Income Securities
At any time, a sharp rise in interest rates could have a material adverse impact on the fair value of our xed income investment portfolio.
Conversely, declines in interest rates could have a material adverse impact on interest income for our investment portfolio. Our xed
income instruments are not leveraged as of July 29, 2006, and are held for purposes other than trading. The following tables present the
hypothetical fair values of xed income securities, including the effects of the interest rate swaps discussed further under “Interest Rate
Derivatives” below, as a result of selected potential market decreases and increases in interest rates. Market changes reect immediate
hypothetical parallel shifts in the yield curve of plus or minus 50 basis points (“BPS”), 100 BPS, and 150 BPS. The hypothetical fair values
as of July 29, 2006 and July 30, 2005 are as follows (in millions):
VALUATION OF SECURITIES
GIVEN AN INTEREST RATE
DECREASE OF X BASIS POINTS
FAIR VALUE
AS OF
JULY 29,
2006
VALUATION OF SECURITIES
GIVEN AN INTEREST RATE
INCREASE OF X BASIS POINTS
(150 BPS) (100 BPS) (50 BPS) 50 BPS 100 BPS 150 BPS
U.S. government notes and bonds $ 5,289 $ 5,238 $ 5,186 $ 5,135 $ 5,084 $ 5,032 $ 4,981
Corporate and municipal notes and bonds
and asset-backed securities 8,772 8,738 8,705 8,670 8,636 8,603 8,568
Total $ 14,061 $ 13,976 $ 13,891 $ 13,805 $ 13,720 $ 13,635 $ 13,549
VALUATION OF SECURITIES
GIVEN AN INTEREST RATE
DECREASE OF X BASIS POINTS
FAIR VALUE
AS OF
JULY 30,
2005
VALUATION OF SECURITIES
GIVEN AN INTEREST RATE
INCREASE OF X BASIS POINTS
(150 BPS) (100 BPS) (50 BPS) 50 BPS 100 BPS 150 BPS
U.S. government notes and bonds $ 3,540 $ 3,503 $ 3,467 $ 3,430 $ 3,393 $ 3,357 $ 3,320
Corporate and municipal notes and bonds
and asset-backed securities 7,101 7,048 6,995 6,942 6,890 6,837 6,784
Total $ 10,641 $ 10,551 $ 10,462 $ 10,372 $ 10,283 $ 10,194 $ 10,104
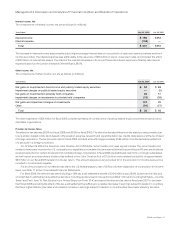
Publicly Traded Equity Securities
The values of our equity investments in several publicly traded companies are subject to market price volatility. The following tables present
the hypothetical fair values of publicly traded equity securities as a result of selected potential decreases and increases in the price of
each equity security in the portfolio, excluding hedged equity securities. Potential uctuations in the price of each equity security in the
portfolio of plus or minus 15%, 25%, and 35% were selected based on the probability of their occurrence. The hypothetical fair values as
of July 29, 2006 and July 30, 2005 are as follows (in millions):
VALUATION OF SECURITIES
GIVEN AN X% DECREASE
IN EACH STOCK’S PRICE
FAIR VALUE
AS OF
JULY 29,
2006
VALUATION OF SECURITIES
GIVEN AN X% INCREASE
IN EACH STOCK’S PRICE
(35%) (25%) (15%) 15% 25% 35%
Publicly traded equity securities $ 421 $ 486 $ 551 $ 648 $ 745 $ 810 $ 875
VALUATION OF SECURITIES
GIVEN AN X% DECREASE
IN EACH STOCK’S PRICE
FAIR VALUE
AS OF
JULY 30,
2005
VALUATION OF SECURITIES
GIVEN AN X% INCREASE
IN EACH STOCK’S PRICE
(35%) (25%) (15%) 15% 25% 35%
Publicly traded equity securities $ 498 $ 575 $ 651 $ 766 $ 881 $ 958 $ 1,034
Quantitative and Qualitative Disclosures About Market Risk