Cisco 2006 Annual Report Download - page 24
Download and view the complete annual report
Please find page 24 of the 2006 Cisco annual report below. You can navigate through the pages in the report by either clicking on the pages listed below, or by using the keyword search tool below to find specific information within the annual report.-
 1
1 -
2
-
3
-
4
-
5
-
6
-
7
-
8
-
9
-
10
-
11
-
12
-
13
-
 14
14 -
 15
15 -
 16
16 -
 17
17 -
 18
18 -
 19
19 -
 20
20 -
 21
21 -
 22
22 -
 23
23 -
 24
24 -
 25
25 -
 26
26 -
 27
27 -
 28
28 -
 29
29 -
 30
30 -
 31
31 -
 32
32 -
 33
33 -
 34
34 -
35
-
36
-
37
-
38
-
39
-
40
-
41
-
42
-
43
-
44
-
45
-
46
-
47
-
48
-
49
-
50
-
51
-
52
-
53
-
54
-
55
-
56
-
57
-
58
-
59
-
60
-
61
-
62
-
63
-
64
-
65
-
66
-
67
-
68
-
69
-
70
-
71
-
72
-
73
-
74
-
75
-
76
-
77
-
78
-
79
 |
 |

2006 Annual Report 27
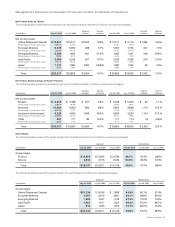
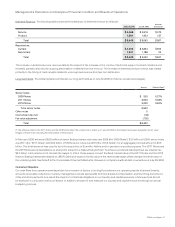
Net Product Sales by Groups of Similar Products
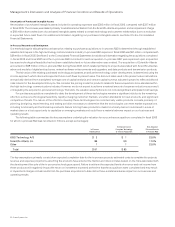
Routers The increase in net product sales related to routers in scal 2006 was due to higher sales of all of our router categories. Our sales
of high-end routers, which represent a larger proportion of our total router sales compared with midrange and low-end routers, increased
by approximately $350 million over the prior scal year. High-end router sales for scal 2006 included approximately $200 million of net
product sales related to products that were previously classied within switches and other product revenue categories during scal 2005.
Our high-end router sales are primarily to service providers, which tend to make large and sporadic purchases. During scal 2006, sales of
our midrange and low-end routers also increased. In scal 2005, we introduced the integrated services router. Sales of integrated services
routers represented approximately 45% of our total revenue from midrange and low-end routers in scal 2006 as compared to
approximately 20% of our total revenue from midrange and low-end routers in scal 2005.
Switches The increase in net product sales related to switches in scal 2006 was due to sales of local-area network (LAN) xed switches
and LAN modular switches. The increase in sales of LAN switches was a result of the continued adoption of new technologies, including
Gigabit Ethernet and Power over Ethernet, by our customers. This has resulted in higher sales of our high-end modular switches, the
Catalyst 6500 Series, and xed switches, including the Cisco Catalyst 3560 Series and the Cisco Catalyst 3750 Series, as new technologies
are deployed throughout the customers’ networks from the core to the wiring closet. For scal 2006, approximately $150 million of net
product sales previously classied within switches for scal 2005 was included in high-end router sales.
Advanced Technologies Scientic-Atlanta contributed net product sales related to advanced technologies of approximately $875 million
during scal 2006, which increased sales of advanced technologies by approximately 19%. Unied communications, formerly enterprise
IP communications, sales increased by approximately $350 million from scal 2005 primarily due to sales of IP phones and associated
software as our customers transitioned from an analog-based to an IP-based infrastructure. Sales of security products increased by
approximately $105 million during scal 2006 primarily due to module and line card sales related to our routers and LAN modular switches
as customers continued to emphasize network security. Sales of storage area networking products increased by approximately $115 million
during scal 2006 and wireless LAN product sales increased by approximately $135 million during scal 2006. Storage area networking
and wireless LAN product sales increased primarily due to new customers and continued deployments with existing customers. Home
networking product sales increased by approximately $180 million during scal 2006, primarily due to the acquisition of Scientic-Atlanta
which contributed approximately $115 million of home networking product sales during scal 2006 and the growth of our wireless and wired
router businesses. We experienced weakness in optical networking sales during scal 2006, with product sales increasing by approximately
$5 million compared to scal 2005; approximately $65 million of these sales during scal 2006 related to Scientic-Atlanta. Our sales of
optical networking products will no longer be included in our advanced technologies product category beginning in scal 2007 and instead
will be included in the other product category. Sales of video systems products of approximately $695 million in scal 2006 were related to
Scientic-Atlanta. Video systems include solutions and systems dedicated to enable video-specic systems, including both transmission
and subscriber equipment, sold directly to service providers. Application networking services and hosted small-business systems, which were
identied as advanced technologies in the second quarter of scal 2006, did not represent a signicant amount of revenue for scal 2006.
Other Product Revenue The increase in other product revenue was due to the strength in sales of our cable and IP communications solutions
to service providers and the contribution of net product sales related to Scientic-Atlanta. Net product sales for mobile wireless products
previously classied in this category in scal 2005 was included in high-end router sales in scal 2006.
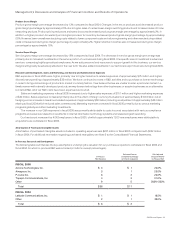
Factors That May Impact Net Product Sales Net product sales may continue to be affected by changes in the geopolitical environment
and global economic conditions; competition, including price-focused competitors from Asia, especially China; new product introductions;
sales cycles and product implementation cycles; changes in the mix of our customers between service provider and enterprise markets;
changes in the mix of direct sales and indirect sales; variations in sales channels; and nal acceptance criteria of the product, system, or
solution as specied by the customer. In addition, sales to the service provider market have been characterized by large and often sporadic
purchases, especially relating to our router sales and sales of certain advanced technologies. In addition, service provider customers
typically have longer implementation cycles, require a broader range of services, including network design services, and often have acceptance
provisions that can lead to a delay in revenue recognition. To improve customer satisfaction, we continue to focus on managing our
manufacturing lead-time performance, which may result in corresponding reductions in order backlog. A decline in backlog levels could
result in more variability and less predictability in our quarter-to-quarter net sales and operating results.
Management’s Discussion and Analysis of Financial Condition and Results of Operations