Cisco 2006 Annual Report Download - page 74
Download and view the complete annual report
Please find page 74 of the 2006 Cisco annual report below. You can navigate through the pages in the report by either clicking on the pages listed below, or by using the keyword search tool below to find specific information within the annual report.-
 1
1 -
2
-
3
-
4
-
5
-
6
-
7
-
8
-
9
-
10
-
11
-
12
-
13
-
14
-
15
-
16
-
17
-
18
-
19
-
20
-
21
-
22
-
23
-
24
-
25
-
26
-
27
-
28
-
29
-
30
-
31
-
32
-
33
-
34
-
35
-
36
-
37
-
38
-
39
-
40
-
41
-
42
-
43
-
44
-
45
-
46
-
47
-
48
-
49
-
50
-
51
-
52
-
53
-
54
-
55
-
56
-
57
-
58
-
59
-
60
-
61
-
62
-
63
-
 64
64 -
 65
65 -
 66
66 -
 67
67 -
 68
68 -
 69
69 -
 70
70 -
 71
71 -
 72
72 -
 73
73 -
 74
74 -
 75
75 -
 76
76 -
 77
77 -
 78
78 -
 79
79
 |
 |

2006 Annual Report 77
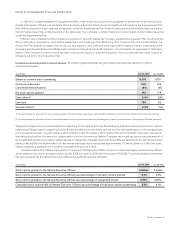
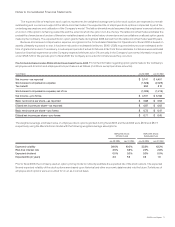
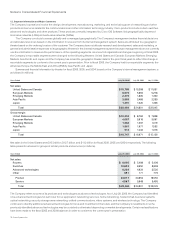
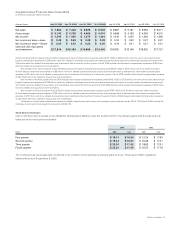
The majority of the Company’s assets as of July 29, 2006 and July 30, 2005 were attributable to its U.S. operations. In scal 2006, 2005,
and 2004, no single customer accounted for 10% or more of the Company’s net sales. Property and equipment information is based on the
physical location of the assets. The following table presents property and equipment information for geographic areas (in millions):
July 29, 2006 July 30, 2005 July 31, 2004
Property and equipment, net:
United States $ 3,082 $ 2,959 $ 2,919
International 358 361 371
Total $ 3,440 $ 3,320 $ 3,290
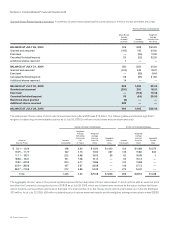
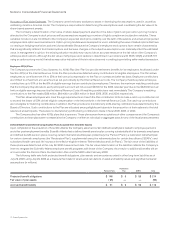
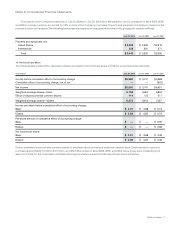
13. Net Income per Share
The following table presents the calculation of basic and diluted net income per share (in millions, except per-share amounts):
Years Ended July 29, 2006 July 30, 2005 July 31, 2004
Income before cumulative effect of accounting change $5,580 $ 5,741 $ 4,968
Cumulative effect of accounting change, net of tax — — (567)
Net income $ 5,580 $ 5,741 $ 4,401
Weighted-average shares—basic 6,158 6,487 6,840
Effect of dilutive potential common shares 114 125 217
Weighted-average shares—diluted 6,272 6,612 7,057
Income per share before cumulative effect of accounting change:
Basic $ 0.91 $ 0.88 $ 0.73
Diluted $ 0.89 $ 0.87 $ 0.70
Per-share amount of cumulative effect of accounting change:
Basic $ — $ — $ 0.09
Diluted $ — $ — $ 0.08
Net income per share:
Basic $ 0.91 $ 0.88 $ 0.64
Diluted $ 0.89 $ 0.87 $ 0.62
Dilutive potential common shares consist primarily of employee stock options and restricted common stock. Employee stock options to
purchase approximately 1.0 billion, 847 million, and 469 million shares in scal 2006, 2005, and 2004, respectively, were outstanding, but
were not included in the computation of diluted earnings per share because the effect would have been antidilutive.
Notes to Consolidated Financial Statements