Cisco 2006 Annual Report Download - page 16
Download and view the complete annual report
Please find page 16 of the 2006 Cisco annual report below. You can navigate through the pages in the report by either clicking on the pages listed below, or by using the keyword search tool below to find specific information within the annual report.-
 1
1 -
2
-
3
-
4
-
5
-
 6
6 -
 7
7 -
 8
8 -
 9
9 -
 10
10 -
 11
11 -
 12
12 -
 13
13 -
 14
14 -
 15
15 -
 16
16 -
 17
17 -
 18
18 -
 19
19 -
 20
20 -
 21
21 -
 22
22 -
 23
23 -
 24
24 -
 25
25 -
 26
26 -
27
-
28
-
29
-
30
-
31
-
32
-
33
-
34
-
35
-
36
-
37
-
38
-
39
-
40
-
41
-
42
-
43
-
44
-
45
-
46
-
47
-
48
-
49
-
50
-
51
-
52
-
53
-
54
-
55
-
56
-
57
-
58
-
59
-
60
-
61
-
62
-
63
-
64
-
65
-
66
-
67
-
68
-
69
-
70
-
71
-
72
-
73
-
74
-
75
-
76
-
77
-
78
-
79
 |
 |
2006 Annual Report 19
Forward-Looking Statements
This Management’s Discussion and Analysis of Financial Condition and Results of Operations contains forward-looking statements
regarding future events and our future results that are subject to the safe harbors created under the Securities Act of 1933 (the “Securities Act”)
and the Securities Exchange Act of 1934 (the “Exchange Act”). These statements are based on current expectations, estimates, forecasts,
and projections about the industries in which we operate and the beliefs and assumptions of our management. Words such as “expects,”
“anticipates,” “targets,” “goals,” “projects,” “intends,” “plans,” “believes,” “seeks,” “estimates,” “continues,” “may,” variations of such words and
similar expressions are intended to identify such forward-looking statements. In addition, any statements that refer to projections of our future
nancial performance, our anticipated growth and trends in our businesses, and other characterizations of future events or circumstances
are forward-looking statements. Readers are cautioned that these forward-looking statements are only predictions and are subject to risks,
uncertainties, and assumptions that are difcult to predict, including those identied below, as well as on the inside back cover of this
Annual Report to Shareholders and under Part I, Item 1A. Risk Factors and elsewhere in our Annual Report on Form 10-K. Therefore, actual
results may differ materially and adversely from those expressed in any forward-looking statements. We undertake no obligation to revise
or update any forward-looking statements for any reason.
Overview
We sell Internet Protocol (IP)-based networking and other products and services related to the communications and information technology
industry that address a wide range of customers’ business needs, including improving productivity, reducing costs, and gaining a competitive
advantage. Our corresponding technology focus is on delivering networking products and solutions that simplify customers’ infrastructures,
offer integrated services, and are highly secure. Our products and services help customers build their own network infrastructures that
support tools and applications that allow them to communicate with key stakeholders, including customers, prospects, business partners,
suppliers, and employees. Our product offerings fall into several categories: our core technologies, routing and switching; advanced
technologies; and other products. In addition to our product offerings, we provide a broad range of service offerings, including technical
support services and advanced services. Our customer base spans virtually all types of public and private agencies and businesses,
comprising large enterprise companies, service providers, commercial, and consumer customers.
In scal 2006, we continued to focus on three long-term nancial priorities:
• Seek protable growth opportunities
• Achieve protability targets and improve productivity
• Increase shareholder value
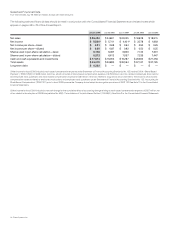
Our results for scal 2006 reected increases in net sales, net income, and net income per share from scal 2005, if the effect of pro forma
stock-based compensation reported in Note 10 to our Consolidated Financial Statements for scal 2005 were included in the calculation of net
income and net income per share for scal 2005. In February 2006, we completed the acquisition of Scientic-Atlanta, Inc. (“Scientic-Atlanta”),
a provider of set-top boxes, end-to-end video distribution networks, and video integration systems. With this acquisition, we have added
video to the convergence of data, voice, and mobility technologies which enables us to be a stronger strategic business partner with our
service provider customers. Fiscal 2006 results include Scientic-Atlanta’s contribution of $989 million in net sales for the ve-month period
subsequent to the acquisition date. We have continued to achieve a good balance in year-over-year revenue growth from our geographic
segments, customer markets, and product families. Revenue increased in our four largest geographic theaters from scal 2005, with the
increase occurring primarily in the United States and in the Emerging Markets theater. Sales of our advanced technologies increased by
34% over scal 2005 in part due to the acquisition of Scientic-Atlanta, which increased sales of advanced technologies by 19%, and also
due to strength in unied communications, wireless technology, storage area networking, and security. Our sales of optical networking
products will no longer be included in our advanced technologies product category beginning in scal 2007 and instead will be included
in the other product category. Both our routing and switching revenue increased by approximately 9% over scal 2005.
For scal 2006, our gross margin percentage decreased compared to scal 2005. The decrease in gross margin percentage from
scal 2005 was primarily related to the acquisition of Scientic-Atlanta, whose business model has a lower gross margin percentage than
the Cisco model. Other factors contributing to the decrease in the gross margin percentage were the sales mix of certain switching and
routing products, and the effect of stock-based compensation expense under SFAS 123(R). These factors were partially offset by lower
manufacturing costs related to lower component costs and higher volume. Operating expenses increased year-over-year due primarily to
increased sales and engineering headcount-related expenses and the effect of our adoption of SFAS 123(R).
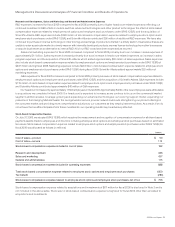
During scal 2006, we focused particular attention on ve key areas: the commercial market segment; additional sales coverage;
growing and expanding our advanced technologies; evolving our support model; and expanding our presence in the Emerging Markets
theater. In addition to continuing our focus on these ve key areas, going forward, we expect to focus on next-generation service provider
network build-outs, strengthening our product offerings in the consumer market, and providing more comprehensive solutions to our
customers as they employ Internet solutions. Indicative of the opportunities in our markets, we continue to encounter price-focused
competition, including competitors from Asia, and in particular China.
Management’s Discussion and Analysis of Financial Condition and Results of Operations